Bitcoin Network Volume Mirrors Mid-2021 ’Stable Equilibrium’ – Is a Monster Rally Imminent?

Bitcoin’s network activity is flashing a familiar signal—one last seen before the 2021 bull run. Traders are circling.
Deja Vu or Destiny?
The Bitcoin network’s current volume levels eerily match those from mid-2021, a period market analysts call a 'stable equilibrium' before prices went parabolic. Now, with institutional interest surging and retail FOMO creeping back, history might be rhyming harder than a Wall Street analyst reading a horoscope.
Liquidity Tightrope
Exchange reserves are thinning while OTC desks report record demand—a classic supply squeeze setup. Meanwhile, futures open interest keeps climbing, though thankfully without the leverage insanity of 2021 (this time it’s 'institutional hedging,' obviously).
The Big If
All eyes are on whether this technical echo becomes fundamental reality. Either way, someone’s about to make—or lose—a fortune while the rest of us watch CNBC anchors try to pronounce 'Wyckoff accumulation.'
Bitcoin Network Volume Stuck In Balance Zone
According to a recent CryptoQuant Quicktake post by contributor AxelAdlerJr, Bitcoin’s network volume has stabilized in a state of ‘stable equilibrium,’ reminiscent of the mid-2021 consolidation phase that preceded a major move.
For the uninitiated, bitcoin network volume refers to the total value of BTC transferred across the blockchain over a specific period, typically used to gauge market activity and capital flow. Higher network volume suggests increased investor engagement and liquidity, while lower volume may indicate reduced interest or market stagnation.
Notably, when BTC reached the upper end of its current range – around $110,000 – its average network volume surged to as high as $67 billion. Since then, the metric has slightly declined and now hovers around $58.7 billion.
Since January 2024, Bitcoin’s average network volume has ranged between $40 billion and $80 billion. According to the CryptoQuant analyst, this corridor has become a key indicator of network activity balance and broader market sentiment.
Historically, when the Bitcoin average volume approached the upper-end of the range at $80 billion, it coincided with local price peaks of $70,000 and $100,000. On the contrary, moves toward the lower-end – around $40 billion – were associated with short-term pullbacks, though these dips were often quickly bought up by market participants.
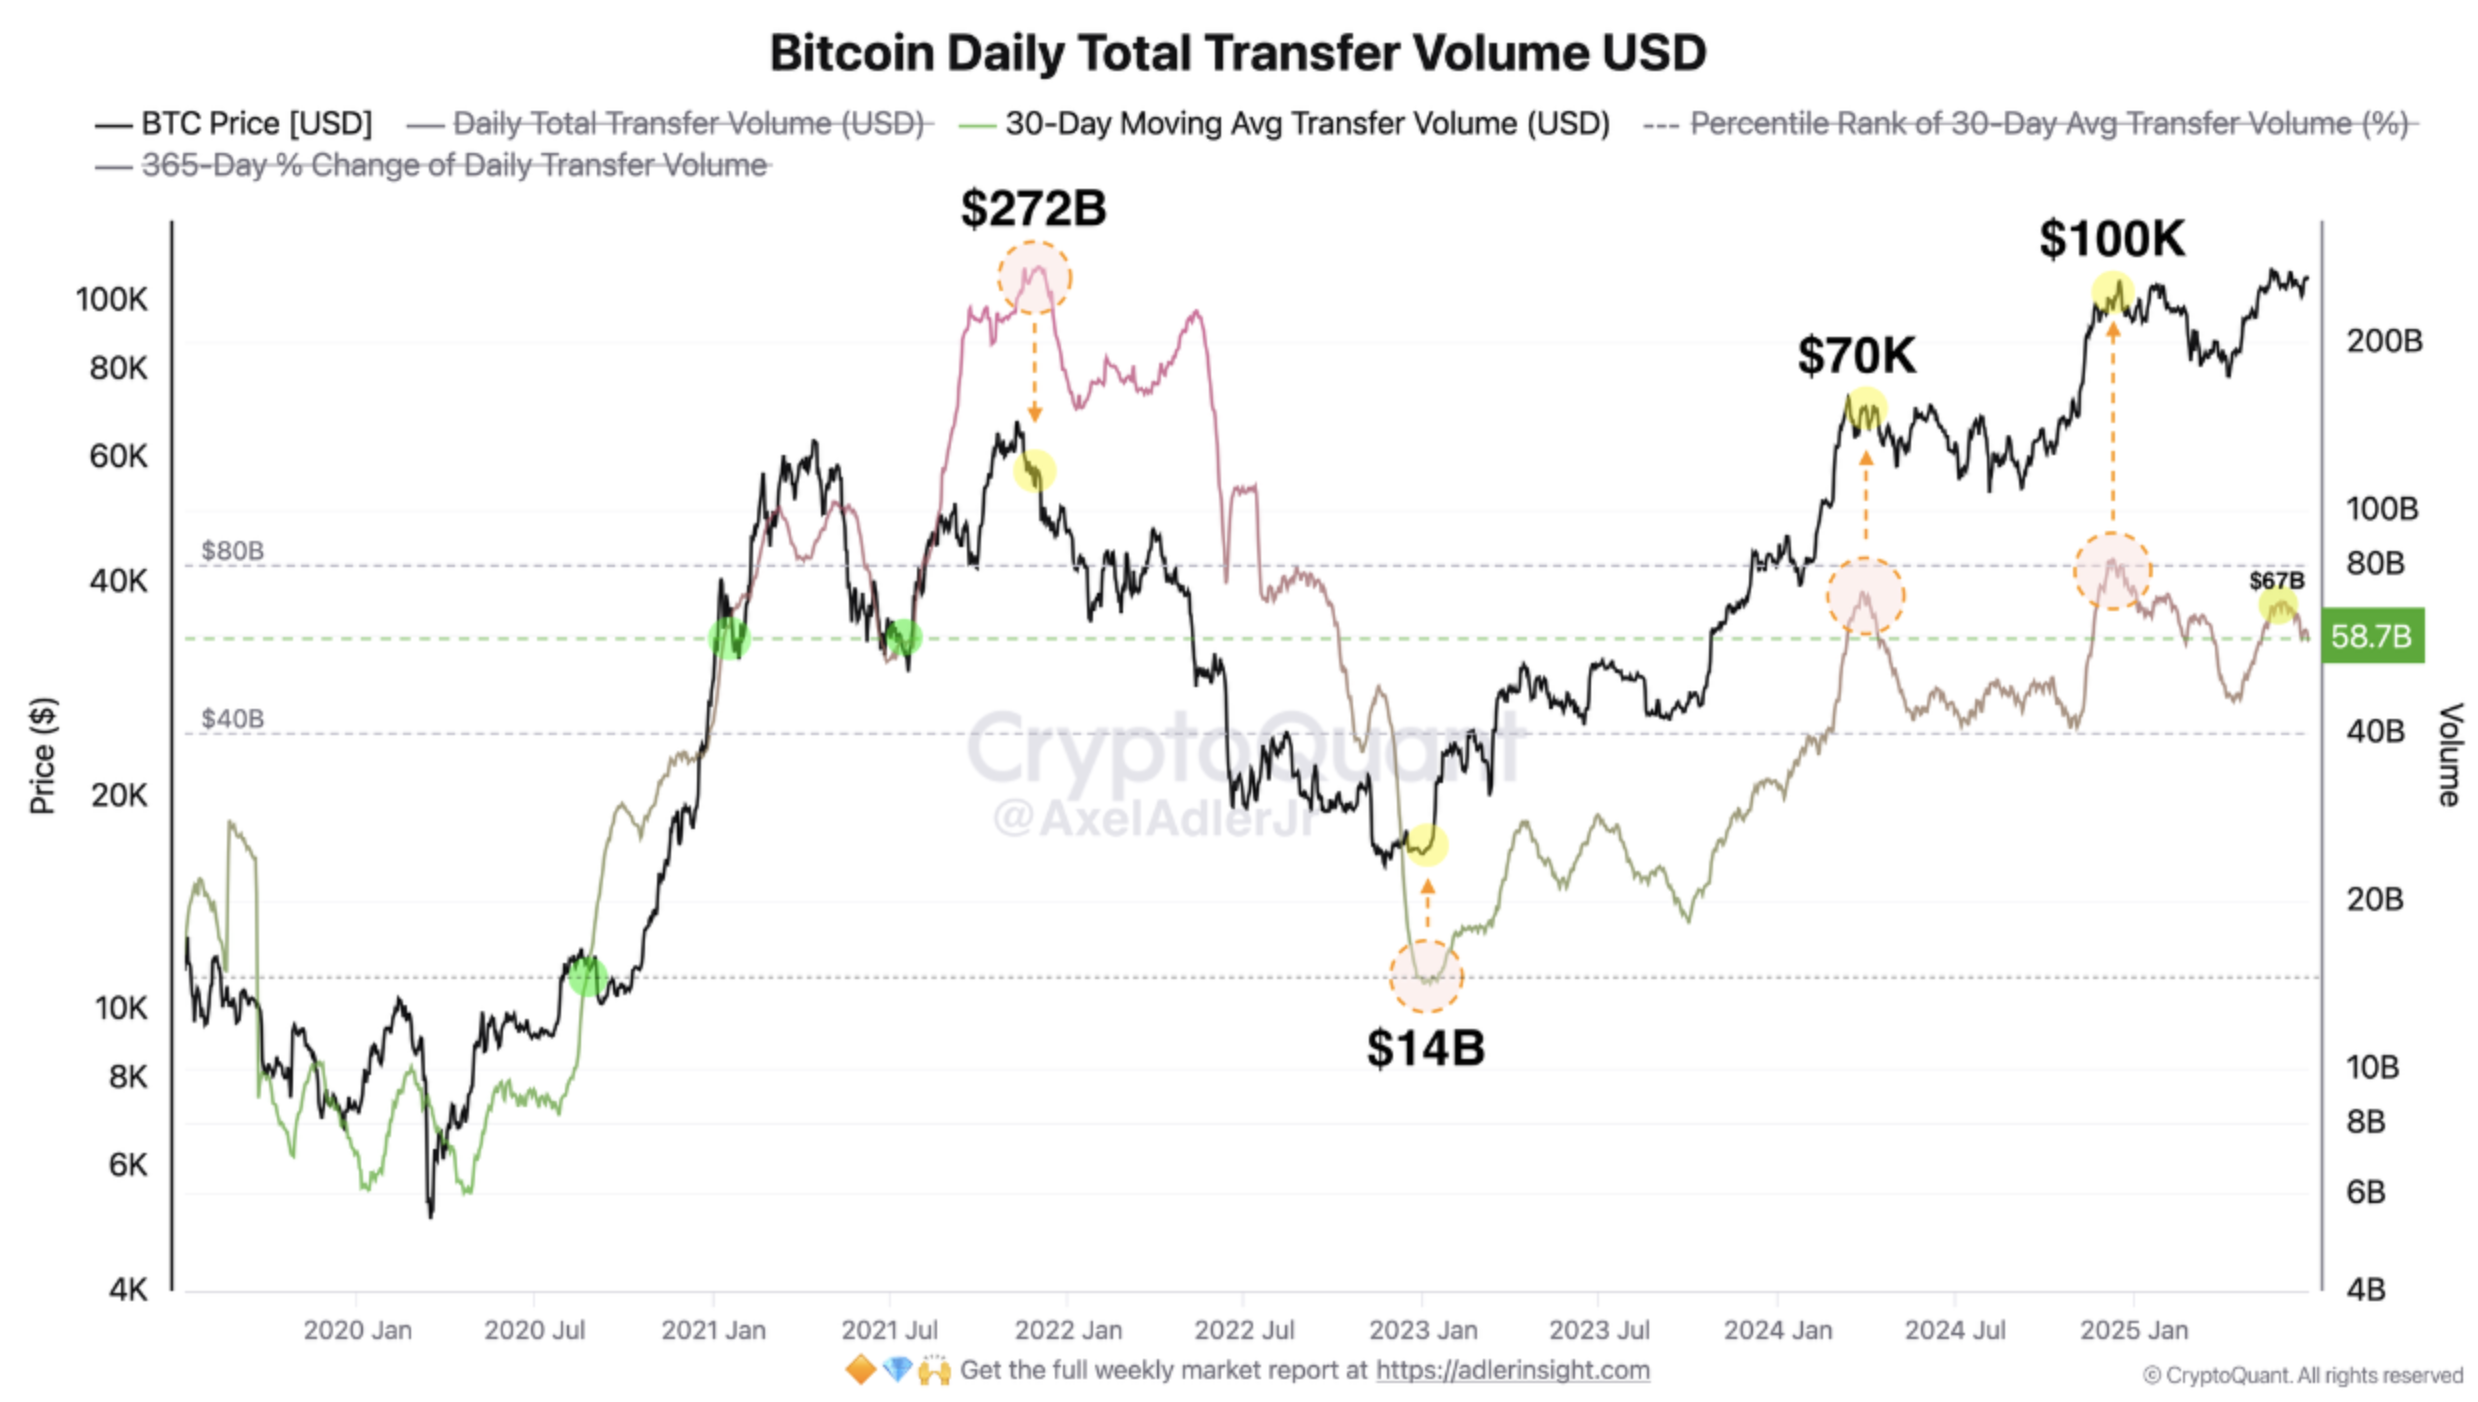
Currently, the $58.7 billion reading sits NEAR the midpoint of this range, mirroring the consolidation phase observed in mid-2021. The analyst explained:
As long as the indicator remains above the $40 billion level, we can speak of a stable fundamental market condition. Rising volumes above the $80 billion mark will confirm strengthening activity and fresh capital inflow. On the other hand, a sustained drop below $40 billion will indicate weakening network demand and may be a harbinger of a deeper correction.
Is BTC Preparing For A Big Move?
While Bitcoin network volume suggests the market is in a state of equilibrium, some on-chain metrics hint at a potential breakout building in the background – possibly paving the way for renewed bullish momentum.
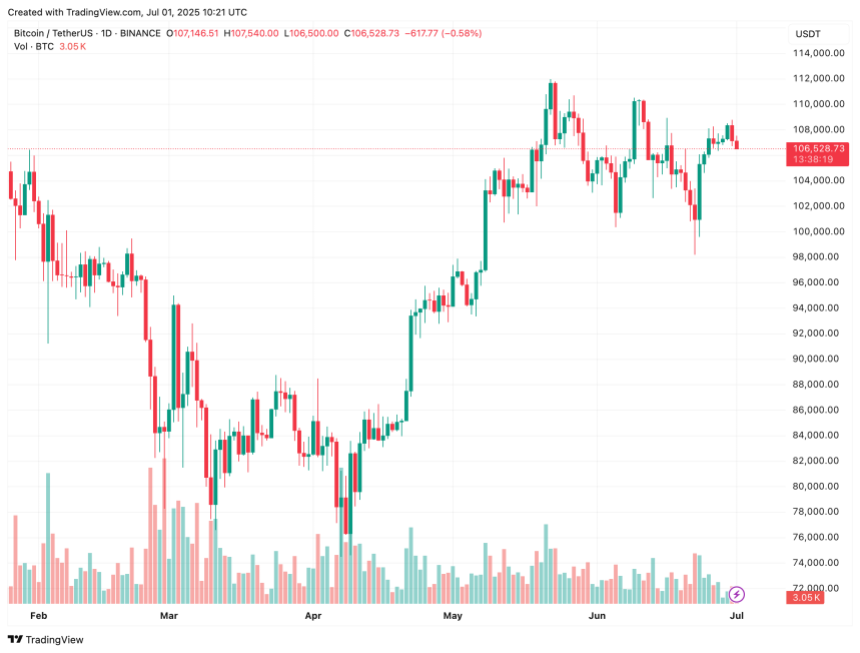
For example, the BTC short-term holder floor has been rising steadily in recent months, currently hovering around $98,000. This provides a strong support base, potentially preventing a sharp downside correction.
However, selling pressure from miners and long-term holders is also beginning to increase – casting some uncertainty over BTC’s short-term price trajectory. At press time, BTC trades at $106,528, down 0.9% in the past 24 hours.

Log in to Reply
Log in to comment your thoughtsComments
Related Articles
|Square
Get the BTCC app to start your crypto journey
Get started today Scan to join our 100M+ users