Bitcoin Defies Gravity: Bullish Monthly Structure Signals Imminent Mega-Rally
Bitcoin isn't just holding—it's coiled like a spring. The monthly chart's bullish structure screams one thing: higher highs are coming.
The calm before the storm?
While traditional markets obsess over Fed whispers and earnings reports, BTC's technicals paint a clearer picture. That 'steady' price action? Just institutions loading up before the real move.
Why this rally has legs
Monthly candles don't lie. The structure mirrors pre-bull run patterns from 2020 and 2016—back when skeptics called it a bubble (and later bought the top). This time? Wall Street's already positioned—mainstream media just hasn't caught up yet.
The cynical truth
Banks will 'discover' Bitcoin's value right around $100K—just in time to sell their ETF bags to retail. But for now? The charts say buy. The smart money's buying. And the monthly structure? It's screaming.
Bitcoin Price Eyes Fresh Gains
Bitcoin price started a fresh increase above the $105,500 zone. BTC gained pace and was able to climb above the $106,500 and $107,200 levels to enter a positive zone.
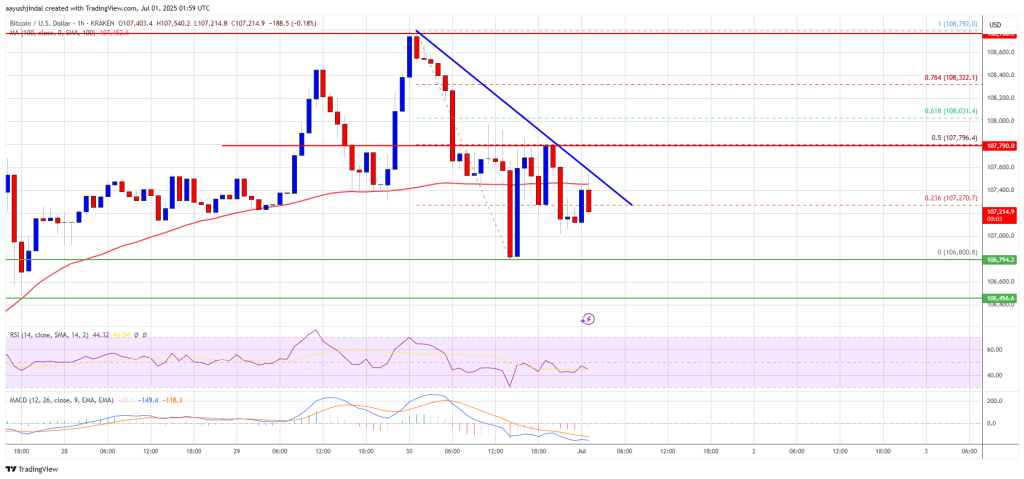
The bulls pushed the price above the $108,000 resistance and the price tested the $108,800 zone. A high was formed at $108,792 and the price recently corrected gains. There was a move below the $107,500 level. A low was formed at $106,800 and the price is now consolidating losses.
There was a recovery above the 23.6% Fib retracement level of the downward move from the $108,792 swing high to the $106,800 low. Bitcoin is now trading below $107,500 and the 100 hourly Simple moving average.
On the upside, immediate resistance is NEAR the $107,400 level. There is also a bearish trend line forming with resistance at $107,400 on the hourly chart of the BTC/USD pair. The first key resistance is near the $108,000 level and the 50% Fib level of the downward move from the $108,792 swing high to the $106,800 low.

A close above the $108,000 resistance might send the price further higher. In the stated case, the price could rise and test the $108,800 resistance level. Any more gains might send the price toward the $110,000 level.
More Losses In BTC?
If bitcoin fails to rise above the $108,000 resistance zone, it could start another decline. Immediate support is near the $106,800 level. The first major support is near the $106,500 level.
The next support is now near the $105,500 zone. Any more losses might send the price toward the $105,000 support in the near term. The main support sits at $103,500, below which BTC might gain bearish momentum.
Technical indicators:
Hourly MACD – The MACD is now losing pace in the bearish zone.
Hourly RSI (Relative Strength Index) – The RSI for BTC/USD is now below the 50 level.
Major Support Levels – $106,800, followed by $106,500.
Major Resistance Levels – $108,000 and $108,800.

