Bitcoin’s Bull Run Isn’t Over Yet — Here’s Why the Rally Could Accelerate

Bitcoin defies gravity again as institutional FOMO meets retail euphoria. The king of crypto isn't just holding support—it's priming for another leg up.
Technical breakout or trap? Chartists point to clean higher highs and lows since the last halving, with the 50-day MA acting like a springboard. Meanwhile, Wall Street's latest 'crypto expert' (read: ex-intern promoted after studying a CoinDesk article) keeps raising price targets.
Momentum breeds momentum. Every dip gets bought, every resistance level becomes support, and every skeptic turns into a 'I-always-believed-in-blockchain' conference speaker. The only thing more predictable than Bitcoin's volatility? Traders front-running the Fed's next dovish pivot.
Watch the $72k level. A clean break here could trigger algorithmic buying from quant funds still using 2021 trading strategies. Just don't mention the 90% drawdowns—that's 'old economy' thinking.
As one hedge fund manager quipped while adjusting his yacht's course: 'In crypto, uptrends last longer than marriages.' The charts agree—for now.
Bitcoin Price Eyes More Gains
Bitcoin price started a fresh increase above the $105,000 zone. BTC gained pace and was able to climb above the $105,500 and $106,500 levels to enter a positive zone.
The bulls pushed the price above the $107,500 resistance and the price tested the $108,800 zone. A high was formed at $108,792 and the price is now consolidating gains above the 23.6% Fib retracement level of the upward move from the $106,477 swing low to the $108,792 high.
Bitcoin is now trading above $107,000 and the 100 hourly Simple moving average. There is also a bullish trend line forming with support at $107,600 on the hourly chart of the BTC/USD pair.
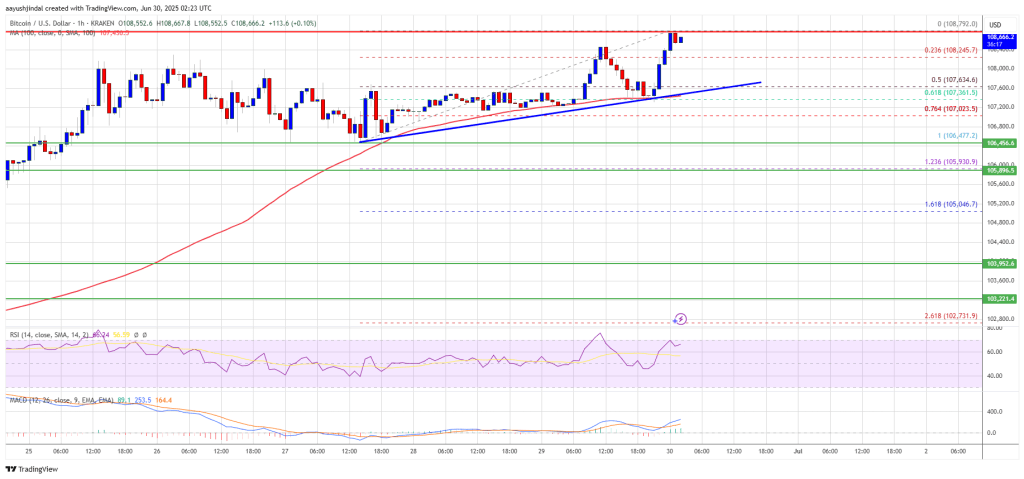
On the upside, immediate resistance is NEAR the $109,800 level. The first key resistance is near the $109,200 level. A close above the $109,200 resistance might send the price further higher. In the stated case, the price could rise and test the $110,000 resistance level. Any more gains might send the price toward the $112,000 level.
Downside Correction Reaction In BTC?
If Bitcoin fails to rise above the $108,800 resistance zone, it could start another decline. Immediate support is near the $107,800 level. The first major support is near the $107,500 level and the trend line.
The next support is now near the $107,200 zone and the 61.8% Fib retracement level of the upward move from the $106,477 swing low to the $108,792 high. Any more losses might send the price toward the $106,500 support in the near term. The main support sits at $105,500, below which BTC might gain bearish momentum.
Technical indicators:
Hourly MACD – The MACD is now gaining pace in the bullish zone.
Hourly RSI (Relative Strength Index) – The RSI for BTC/USD is now above the 50 level.
Major Support Levels – $107,500, followed by $107,200.
Major Resistance Levels – $108,800 and $110,000.

Log in to Reply
Log in to comment your thoughtsComments
Related Articles
|Square
Get the BTCC app to start your crypto journey
Get started today Scan to join our 100M+ users