Bitcoin’s $110K Breakout: The Wedge That Could Make or Break BTC’s Rally

Bitcoin's coiled at a tipping point—again. The $110,000 price target isn't just hopium; it's a technical inevitability if BTC slices through this tightening wedge pattern. Here's why traders are glued to the charts.
The Wedge: A Spring Loaded for Launch
Symmetrical wedges don't care about your feelings. They’re mathematical chokeholds—and Bitcoin’s been grinding inside one for weeks. Break north? Rally to six figures. Fail? Prepare for the usual crypto tantrum.
Wall Street’s Watching (But They Still Don’t Get It)
Institutional desks are suddenly scribbling ‘wedge breakout’ on their whiteboards—right next to ‘blockchain not Bitcoin’ notes from 2018. Meanwhile, retail traders are leveraged long, praying the Fed doesn’t sneeze.
History Says ‘Send It’
Past BTC wedges led to 40%+ moves. At current levels, that math pencils out to… yep, $110K. Cue the ‘this time it’s different’ chorus from the same guys who missed the last 10x.
The Cynic’s Corner
If this breakout fails, expect a 20% haircut—and another round of ‘Bitcoin is dead’ hot takes from CNBC. Because nothing fuels crypto like unjustified skepticism.
Wedge Formation Stalls Bitcoin Below $108,000
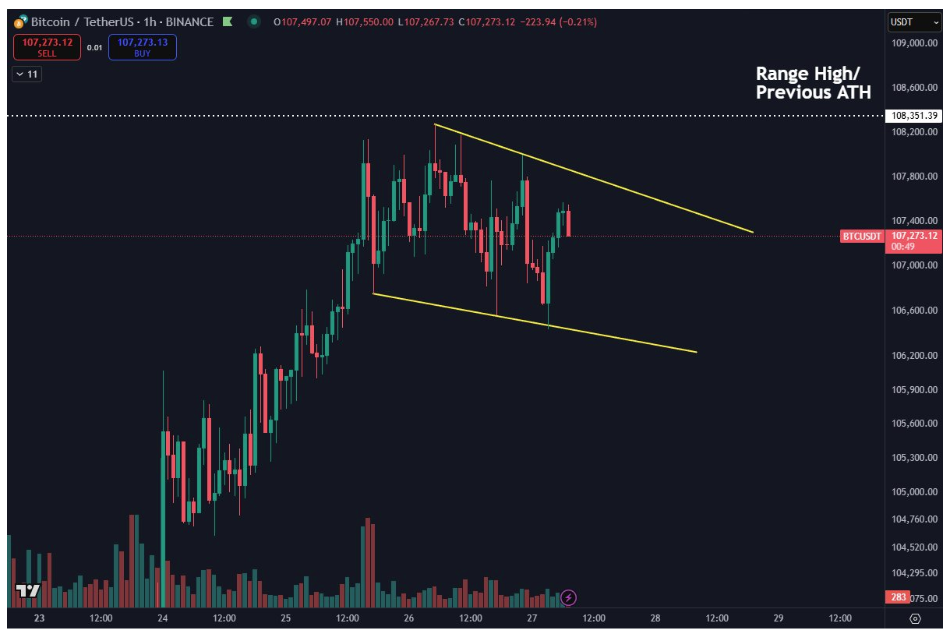
Bitcoin has been consolidating within a descending wedge pattern over the past few days, as shown in the one-hour candlestick timeframe chart below. This consolidation came after Bitcoin rejected just above $108,000 on July 26.
Notably, this pattern has formed beneath the $108,351 level, which is around the previous all-time high and is an important point of resistance in the current range. The pattern reflects a tightening of price action, with lower highs squeezing the price into a narrow range. Furthermore, on-chain trading volume has been relatively stable throughout this consolidation, with no strong directional bias yet.
According to Daan’s analysis, even though this kind of setup could lead to a strong breakout, it may still take time to resolve. “It has been pretty choppy,” the analyst noted. The market’s lack of conviction is shown by Bitcoin’s repeated rejections just under the $108,000 level on multiple one-hour candlestick charts.
A Clean Break Above $110k Could Change Everything
Despite the relatively muted short-term moves, the wedge pattern is building pressure. A confirmed breakout above the upper resistance line, especially with a decisive close beyond $108,000 could mean the beginning of a much larger move. This close WOULD be much more confirming on larger timeframes.
Crypto analyst recommended zooming out to larger timeframes and waiting for that proper break above the $108,000 to $110,000 region. A proper breakout of bitcoin above this range would also have a broader impact across the market and revive interest in altcoins.
Without this breakout, however, Bitcoin is stuck within what the analyst describes as a “massive resistance in a larger range.” In this scenario, the leading cryptocurrency will be at risk of another downside volatility, especially if the support at the lower boundary of the wedge fails.
At the time of writing, Bitcoin is trading at around $107,447. Though the hourly price structure shows strength in rebounding from intraday lows NEAR $106,200, Bitcoin bulls must now contend with the narrowing price action. The wedge formation shows that Bitcoin is gearing up for its next major move, but whether it will be upward or downward depends on how price reacts to the wedge boundaries and the $108,000 resistance line.
Featured image from Unsplash, chart from TradingView
