Bitcoin Stuck in Sideways Limbo – Will Bulls Charge After This Brief Dip?

Bitcoin's price action has flatlined—again. The crypto king's stuck in its usual pre-volatility nap, teasing traders with another 'will they, won't they' moment.
Bulls vs. Bears: Who Blinks First?
The charts show textbook consolidation after last week's 8% pullback. Textbook, that is, if textbooks included leveraged degens sweating over 1-minute candles. Every sideways day now feels like the calm before either a 20% breakout or another 'macro headwind' excuse (thanks, Fed).
Dip Buyers Loading Up?
On-chain data shows whales accumulating at these levels—because nothing says 'smart money' like frontrunning the same retail traders you'll later dump on. Meanwhile, perpetual funding rates hover near neutral, suggesting even leveraged traders can't decide if this is accumulation or distribution.
The Cynical Take
Let's be real: This 'critical inflection point' narrative gets recycled every 3% move. But sure, maybe this time the 'bulls stepping in' will look different than the last six fakeouts. Just remember—in crypto, 'sideways' is Latin for 'about to wreck someone's margin position.'
Bitcoin Price Faces Resistance
Bitcoin price started a fresh increase above the $104,200 zone. BTC gained pace and was able to climb above the $105,000 and $105,500 levels to enter a positive zone.
The bulls pushed the price above the $106,500 resistance and the price tested the $108,150 zone. A high was formed at $108,165 and the price is now consolidating gains. There was a break below a bullish trend line with support at $107,300 on the hourly chart of the BTC/USD pair.
However, the price stayed above the 23.6% Fib retracement level of the upward move from the $98,272 swing low to the $108,165 high. Bitcoin is now trading above $106,000 and the 100 hourly Simple moving average.
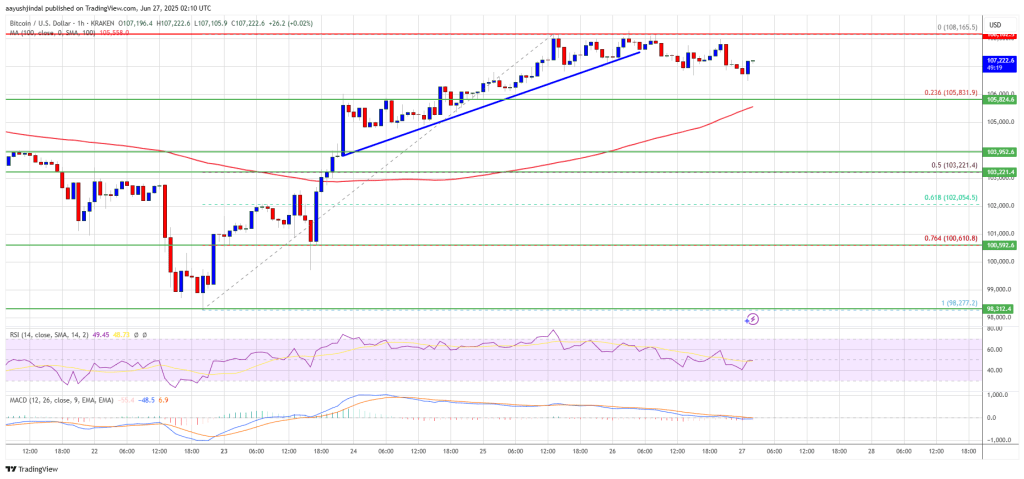
On the upside, immediate resistance is NEAR the $107,800 level. The first key resistance is near the $108,150 level or the 1.236 Fib extension level of the downward move from the $106,470 swing high to the $98,276 low. A close above the $108,150 resistance might send the price further higher. In the stated case, the price could rise and test the $110,000 resistance level. Any more gains might send the price toward the $112,000 level.
Bearish Reaction In BTC?
If bitcoin fails to rise above the $108,150 resistance zone, it could start another decline. Immediate support is near the $105,800 level. The first major support is near the $105,000 level.
The next support is now near the $103,200 zone and the 50% Fib retracement level of the upward move from the $98,272 swing low to the $108,165 high. Any more losses might send the price toward the $102,500 support in the near term. The main support sits at $101,200, below which BTC might gain bearish momentum.
Technical indicators:
Hourly MACD – The MACD is now losing pace in the bullish zone.
Hourly RSI (Relative Strength Index) – The RSI for BTC/USD is now below the 50 level.
Major Support Levels – $105,800, followed by $105,500.
Major Resistance Levels – $107,800 and $108,150.

Log in to Reply
Log in to comment your thoughtsComments
Related Articles
|Square
Get the BTCC app to start your crypto journey
Get started today Scan to join our 100M+ users