🚀 Solana (SOL) Primed for Explosive Breakout: $150 Breakout Could Trigger Massive Rally

Solana's price action is flashing bullish signals—and traders are eyeing a potential moonshot if it clears the $150 resistance.
The Setup: SOL has been consolidating in a tightening range, with liquidity stacking up just above key psychological levels. A decisive close above $150 could trigger a cascade of algorithmic and retail buying.
Why It Matters: Breakouts at these levels have historically led to violent upside moves in SOL (just ask the overleveraged degens from last cycle). Market makers seem to be positioning for volatility—options flow shows heavy call skew.
The Catch: Watch for fakeouts. Crypto markets love to 'run the stops' before committing to a direction. And let's be real—if Wall Street could front-run this trade, they'd have already ETF'd it.
Solana Price Aims For More Gains
Solana price remained supported above $125 and started a fresh increase, like Bitcoin and Ethereum. SOL gained pace and traded above the $132 resistance level.
The bulls pushed the price above the $142 and $145 levels. They are now facing hurdles NEAR $148 and $150. A high was formed at $147 and the price is now consolidating gains above the 23.6% Fib retracement level of the upward move from the $126 swing low to the $147 swing high.
Solana is now trading above $142 and the 100-hourly simple moving average. There is also a key bullish trend line forming with support at $142 on the hourly chart of the SOL/USD pair.
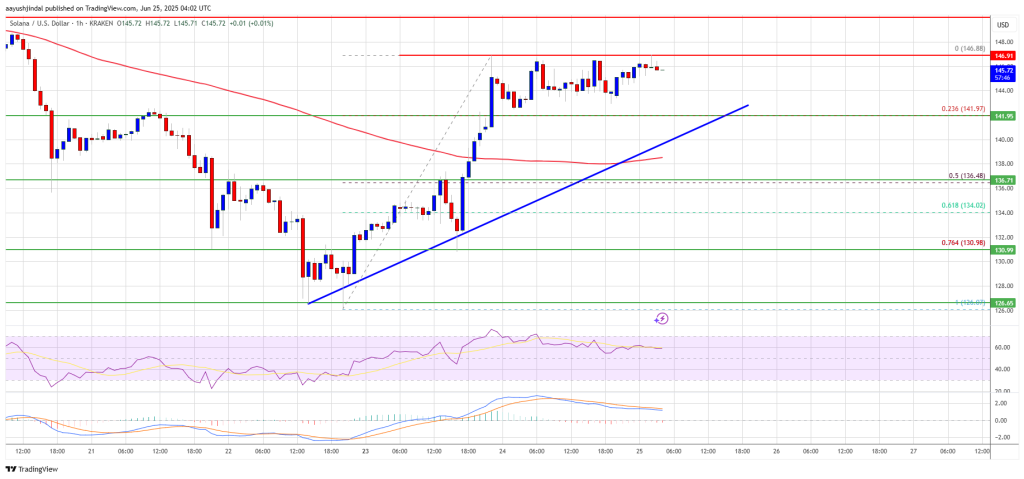
On the upside, the price is facing resistance near the $148 level. The next major resistance is near the $150 level. The main resistance could be $155. A successful close above the $155 resistance zone could set the pace for another steady increase. The next key resistance is $160. Any more gains might send the price toward the $165 level.
Another Decline in SOL?
If SOL fails to rise above the $150 resistance, it could start another decline. Initial support on the downside is near the $142 zone. The first major support is near the $136 level or the 50% Fib retracement level of the upward MOVE from the $126 swing low to the $147 swing high.
A break below the $136 level might send the price toward the $130 zone. If there is a close below the $130 support, the price could decline toward the $125 support in the near term.
Technical Indicators
Hourly MACD – The MACD for SOL/USD is losing pace in the bullish zone.
Hourly Hours RSI (Relative Strength Index) – The RSI for SOL/USD is above the 50 level.
Major Support Levels – $142 and $136.
Major Resistance Levels – $148 and $150.
