Bitcoin Bulls Charge Again – New ATH Imminent If Momentum Holds

Bitcoin's price surge has traders buzzing as the crypto king flirts with all-time highs. The bulls are back in control—but can they sustain the pressure?
Market Pulse: Green Dominates
After weeks of consolidation, BTC suddenly woke up with vengeance. The charts show textbook bullish momentum, though skeptics whisper about overleveraged positions (as if Wall Street doesn't run on leverage 24/7).
Key Resistance Levels to Watch
The $75K psychological barrier just got smashed. Now all eyes are on the $80K handle—a break past that could trigger a full-blown FOMO rally. Meanwhile, institutional money keeps playing catch-up like a hedge fund tourist at a Cypherpunk conference.
Make-or-Break Moment
This isn't your 2021 meme-stock frenzy. Real adoption metrics—Lightning Network growth, ETF inflows, institutional custody solutions—are finally supporting the price action. But remember: in crypto, 'fundamentals' is just Latin for 'narrative we're pushing this quarter.'
Bitcoin Price Eyes More Gains
Bitcoin price started a fresh increase above the $102,500 zone. BTC gained pace and was able to climb above the $103,200 and $103,500 levels to enter a positive zone.
The bulls pushed the price above the 76.4% Fib retracement level of the downward move from the $106,470 swing high to the $98,276 low. It opened the doors for a push above the $106,000 resistance and the price tested the $106,500 zone.
Bitcoin is now trading above $105,000 and the 100 hourly Simple moving average. There is also a bullish trend line forming with support at $106,000 on the hourly chart of the BTC/USD pair.
On the upside, immediate resistance is NEAR the $106,500 level. The first key resistance is near the $107,200 level. The next key resistance could be $108,500 or the 1.236 Fib extension level of the downward move from the $106,470 swing high to the $98,276 low.
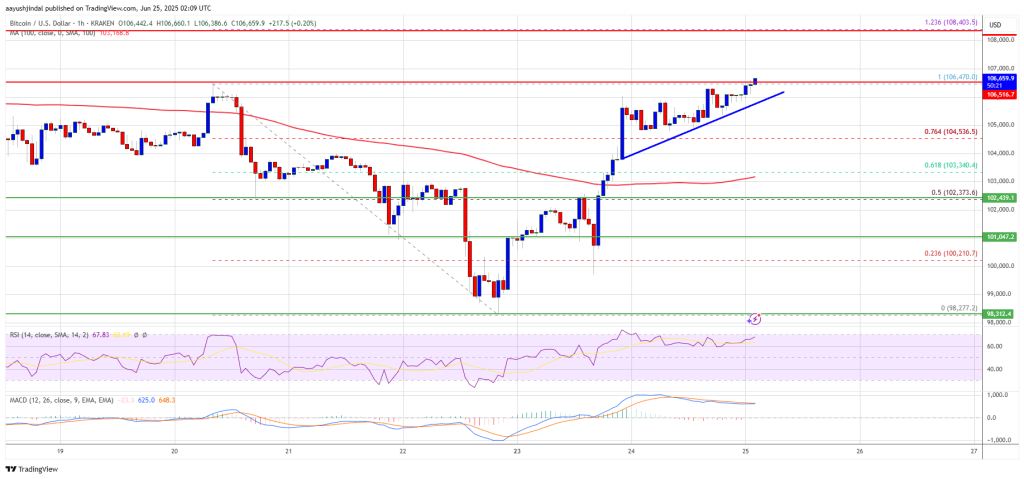
A close above the $108,500 resistance might send the price further higher. In the stated case, the price could rise and test the $110,000 resistance level. Any more gains might send the price toward the $112,000 level.
Another Drop In BTC?
If Bitcoin fails to rise above the $106,500 resistance zone, it could start another decline. Immediate support is near the $106,000 level. The first major support is near the $105,500 level.
The next support is now near the $104,200 zone. Any more losses might send the price toward the $103,500 support in the near term. The main support sits at $102,000, below which BTC might struggle to find bids.
Technical indicators:
Hourly MACD – The MACD is now gaining pace in the bullish zone.
Hourly RSI (Relative Strength Index) – The RSI for BTC/USD is now above the 50 level.
Major Support Levels – $106,000, followed by $105,500.
Major Resistance Levels – $106,500 and $108,500.
