Bitcoin’s Bullish Divergence Signals Another Run? May’s ATH Pattern Repeats in June 2025

Bitcoin's chart is flashing a familiar signal—one that last appeared just before its May all-time high. The return of this bullish divergence has traders buzzing about another potential surge.
The setup: When price action and momentum indicators diverge, it often precedes big moves. This same technical pattern marked Bitcoin's last major rally—and now it's back.
Market watch: While traditional finance scrambles to explain crypto's resilience ('It's just gambling!' cries one CNBC analyst between commercials for gold ETFs), Bitcoin's technicals keep telling their own story.
Bottom line: History doesn't repeat, but it often rhymes. Whether this divergence leads to new highs or just trader deja vu remains to be seen—but in crypto, even failed patterns make someone rich.
Return Of Rare Divergence Pattern On Bitcoin’s 4H Chart
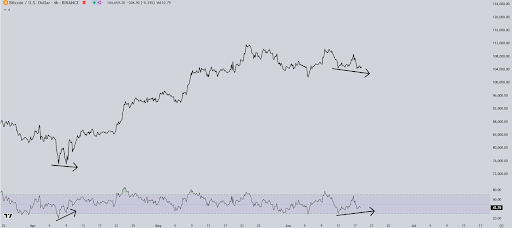
Crypto analyst Luca (@CrypticTrades_) took to social media platform X to share a chart that highlights an important technical development on Bitcoin’s 4-hour timeframe: the return of a bullish divergence. This signal, which previously appeared in early April, preceded the massive rally that catapulted Bitcoin to its May 22 all-time high of $111,800. The same divergence is forming once again and another Bitcoin price breakout may be very close.
As shown in the 4-hour candlestick timeframe chart below, the divergence is clearly illustrated between price action and the Relative Strength Index (RSI). Price has been forming lower lows, while the RSI has been printing higher lows. This mismatch serves as an early indicator that selling momentum is fading, and a reversal to the upside could follow. The previous instance of this pattern directly preceded a sharp MOVE from a $74,000 low in early April to above $111,000 in just a few weeks.
What Does This Divergence Mean For Bitcoin’s Price?
Bullish divergences on mid-timeframe charts like the 4-hour have a reputation for being the first reversal signals when supported by rising volume. In Bitcoin’s current case, the appearance of this pattern again could mean that the recent retracement from $111,800 has run its course. With RSI now trending upward even as price presses slightly lower, Bitcoin may be witnessing another hidden accumulation phase before its next leg higher.
If the pattern holds true to its previous performance in April, the leading cryptocurrency could be setting up for another push toward new all-time high levels. bitcoin is currently not far off from a new all-time high, as it is only about 5.5% away from its price peak. Based on this, another strong breakout could easily aim beyond the previous $111,800 high.
Although Bitcoin’s price is relatively stagnant for now, the presence of this bullish divergence is a reminder of how quickly things can change. The previous bullish divergence ended up with a 50% price surge. A similar performance from the current price level WOULD translate to another target above $160,000.
At the time of writing, Bitcoin is trading at $105,700, up by 1.4% in the past 24 hours, already showing signs of the bullish divergence signal coming into action.
