Bitcoin’s Bull Run Stumbles—Analyst Warns of Sharp Drop Below $94K

Bitcoin’s relentless rally hits a speed bump as traders brace for turbulence. The king of crypto faces its first real test since smashing through six figures—and not everyone’s convinced it’ll hold.
Brace for impact: The $94K support level looms large
Analysts are flashing warning signs after BTC’s momentum stalled near record highs. The same ‘experts’ who missed the 2024 rally now see blood in the water—because nothing sells subscriptions like fear in a bull market.
Meanwhile, Wall Street’s latecomers are suddenly very interested in ‘risk management’—just as their boomer clients start asking about ‘that internet money.’
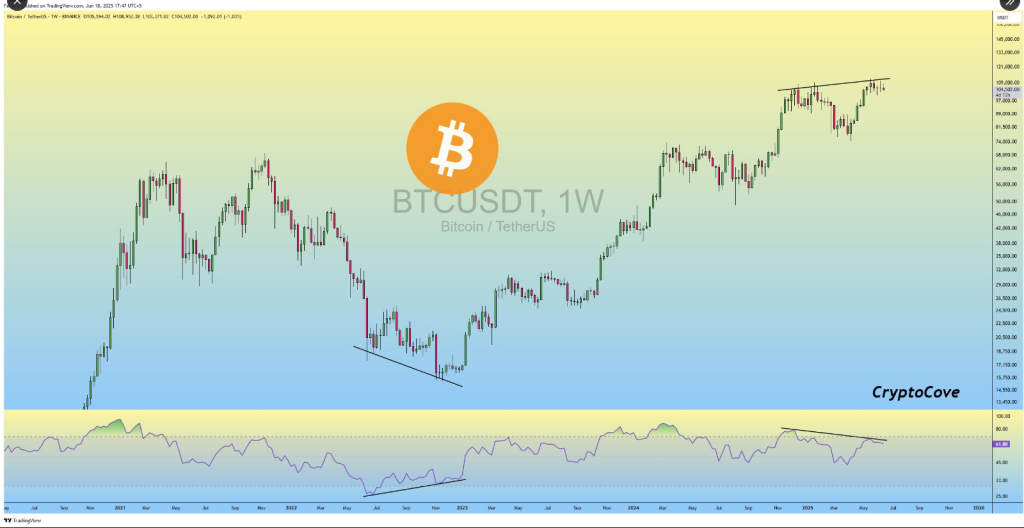
Bearish RSI Divergence Signals Weakness
Based on data, the Relative Strength Index (RSI) has drifted downward after peaking NEAR 80, even as Bitcoin’s price pushed to fresh highs. The RSI now sits at 61.88, a clear sign that buyers are losing steam.
Traders often watch for this kind of mismatch—when price goes up but RSI goes down—because it can spell a coming pullback. History shows it doesn’t always lead to a crash, but it does make a correction more likely.
After carving out fresh highs, it feels like bitcoin has hit its ceiling, according to Fabik, and a pullback into the $92,000–$94,000 zone could be on the cards.
This setup usually sparks a quick correction, so many traders will be watching closely and tightening up their strategies as the market could shift in a hurry.
$BTC is showing a massive RSI Bearish divergence on the weekly chart..!!
It looks like Bitcoin has topped out and is now Ready for a major correction toward the 92–94k Range..![]()
Just like it bottomed out at 16k in November 2022, We bought the dip and now we’re selling the… pic.twitter.com/W25HCAxkIa
— Captain Faibik![]() (@CryptoFaibik) June 18, 2025
(@CryptoFaibik) June 18, 2025
Resistance Levels Keep Price In Check
Bitcoin has bumped into stiff barriers around $108,000 and $109,000, both set on May 19. An ascending trendline from December 2024 has also been capping gains for weeks.
These levels are proving tough to clear. If Bitcoin can’t break through soon, sellers may step in. Faibik points out that hitting these walls and seeing RSI divergence at the same time often marks the high point before a drop.
The derivatives market adds another layer to the story. Trading volume in Bitcoin futures and options rose by 1.60%, taking total activity to around $100 billion. Open interest, meanwhile, slid down 1.30% to nearly $70 billion.
This suggests some players are closing their bets rather than piling on new ones. In the past 24 hours, liquidations have wiped out $71 million in long positions. That kind of pain can trigger more sell‑offs if people rush to protect their profits.
Past Patterns Offer Mixed LessonsLooking back, Bitcoin’s rebound in 2022 followed a different playbook. Back then, price hit a low near $16,000 and built strength even as RSI climbed from oversold levels. That setup led to a strong rally. Today, though, the RSI is nowhere near oversold territory. It’s more of a warning flag than a green light.
Captain Faibik reminds traders that past wins don’t guarantee future results. Conditions now include higher interest rates and deeper institutional interest, which can change how Bitcoin reacts to the same signals.
Featured image from Trade Brains, chart from TradingView
