Ethereum Price Under Siege — Will Bulls Survive the Storm Before the Rebound?

Ethereum's price action is looking grim—another leg down before the cavalry arrives?
Market Pulse: ETH Tests Trader Patience
Another day, another test of hodler resolve. Ethereum’s chart is painting a classic 'buy the dip' setup—if you ignore the 20% bleed from last month’s highs. Traders are either licking their wounds or salivating at discount ETH. Same story, different cycle.
Technical Outlook: Pain Thresholds
The $3,200 support level just became the new battleground. Break that, and we’re staring down the abyss toward $2,800—where the ‘generational buying opportunity’ crowd starts hyperventilating. Meanwhile, perpetual funding rates flipped negative. Again. Because nothing says ‘healthy market’ like leveraged degens shorting into oversold conditions.
Macro Headwinds: Not Just a Crypto Problem
Traditional markets are sneezing, and crypto caught the flu. Fed hawkishness + ETF outflows = perfect storm for risk assets. But let’s be real—when has Ethereum ever taken the easy path to new ATHs? (Spoiler: Never.)
Closing Thought: The Cynic’s Take
Wall Street’s latest ‘crypto winter’ narrative ignores one truth: Ethereum’s obituary gets written every 18 months. Yet here we are—still printing blocks, still breaking everything. Place your bets accordingly.
Ethereum Price Faces Resistance
Ethereum price started a fresh decline below the $2,620 pivot level, like Bitcoin. ETH price declined below the $2,600 and $2,550 levels.
The bears even pushed the price below the $2,500 level. The pair tested the $2,450 zone and started a consolidation phase. There was a minor MOVE above the $2,500 level. The price climbed above the 23.6% Fib retracement level of the downward wave from the $2,680 swing high to the $2,455 low.
Ethereum price is now trading below $2,550 and the 100-hourly Simple Moving Average. Besides, there is a rising channel forming with support at $2,480 on the hourly chart of ETH/USD.
On the upside, the price could face resistance NEAR the $2,540 level. The next key resistance is near the $2,565 level. It is close to the 50% Fib retracement level of the downward wave from the $2,680 swing high to the $2,455 low. The first major resistance is near the $2,625 level.
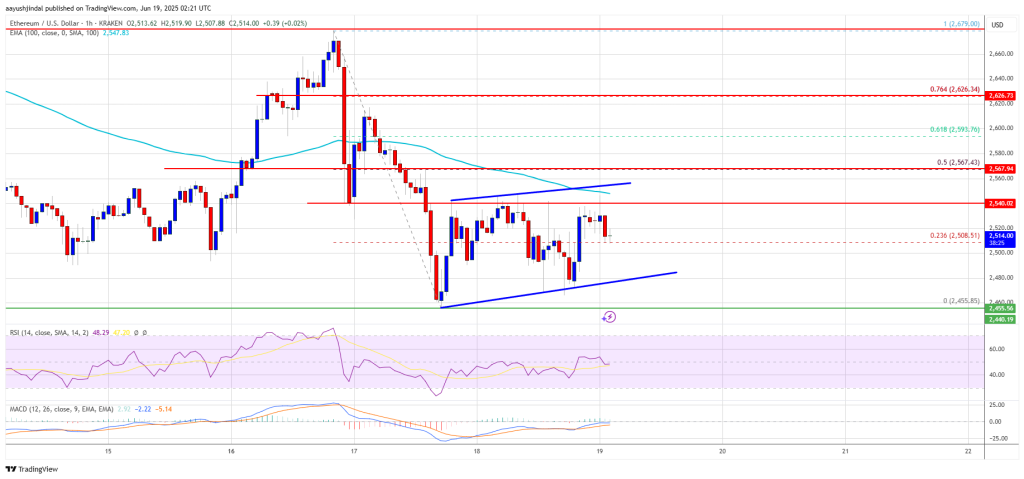
A clear move above the $2,625 resistance might send the price toward the $2,680 resistance. An upside break above the $2,680 resistance might call for more gains in the coming sessions. In the stated case, Ether could rise toward the $2,800 resistance zone or even $2,880 in the near term.
Another Decline In ETH?
If ethereum fails to clear the $2,540 resistance, it could start a fresh decline. Initial support on the downside is near the $2,480 level. The first major support sits near the $2,450 zone.
A clear move below the $2,450 support might push the price toward the $2,320 support. Any more losses might send the price toward the $2,240 support level in the near term. The next key support sits at $2,150.
Technical Indicators
Hourly MACDThe MACD for ETH/USD is losing momentum in the bearish zone.
Hourly RSIThe RSI for ETH/USD is now below the 50 zone.
Major Support Level – $2,450
Major Resistance Level – $2,540
