Bitcoin Battles Resistance: Is This the Dip Before the Rip?

Bitcoin''s latest rally just hit a wall—classic resistance playing spoiler again. The king of crypto got rejected at a key level, leaving traders sweating over their leveraged longs. But here''s the twist: every major pullback has been a buying opportunity since 2023.
When whales play ping-pong with liquidity
The order books show massive sell walls at $70K, but on-chain data reveals accumulation below $65K. Somebody''s playing both sides—probably the same hedge funds that shorted Tesla last quarter.The bullish case nobody''s talking about
While retail panics, institutional inflows into Bitcoin ETFs hit $1.2B this week. Wall Street''s ''smart money'' is quietly loading up during this dip—just like they did before the 2024 halving rally.Here''s the cold truth: Bitcoin doesn''t care about your stop losses. It''ll shake out weak hands, pump when you least expect it, and make financial advisors look foolish (again). Maybe that''s why gold bugs are suddenly learning Python.
Bitcoin Price Dips Again
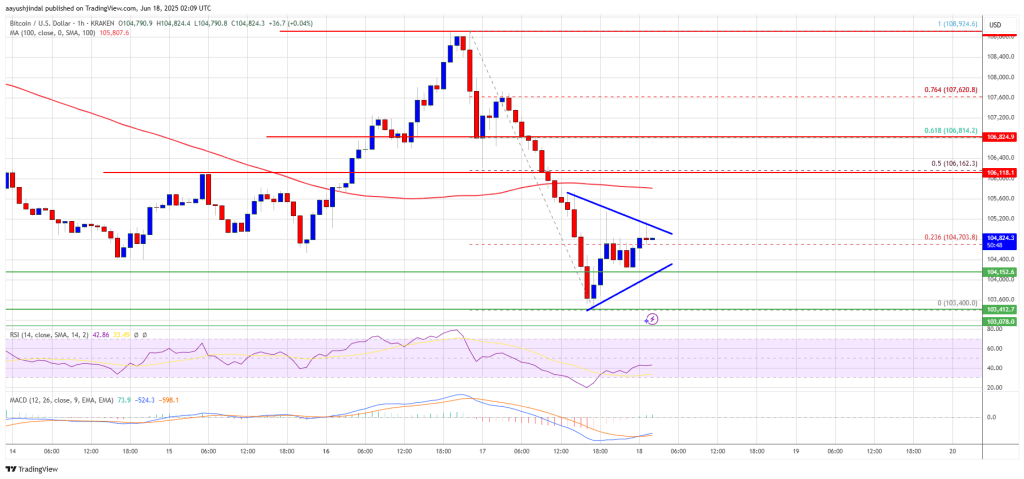
Bitcoin price started a fresh decline after it failed to clear the $108,800 resistance zone. BTC dipped below the $108,000 and $107,000 levels.
There was a clear MOVE below the $106,200 support level. Finally, the price tested the $103,500 zone. A low was formed at $103,400 and the price is now consolidating losses. There was a minor increase above the 23.6% Fib retracement level of the downward move from the $108,924 swing high to the $103,400 low.
Bitcoin is now trading below $106,800 and the 100 hourly Simple moving average. Besides, there is a short-term triangle forming with support at $104,200 on the hourly chart of the BTC/USD pair.
On the upside, immediate resistance is near the $105,200 level. The first key resistance is near the $105,500 level. The next key resistance could be $106,200. It is near the 50% Fib retracement level of the downward move from the $108,924 swing high to the $103,400 low.
A close above the $106,200 resistance might send the price further higher. In the stated case, the price could rise and test the $108,000 resistance level. Any more gains might send the price toward the $110,000 level.
More Losses In BTC?
If Bitcoin fails to rise above the $106,200 resistance zone, it could start another decline. Immediate support is near the $104,200 level. The first major support is near the $103,500 level.
The next support is now near the $102,500 zone. Any more losses might send the price toward the $101,200 support in the near term. The main support sits at $100,000, below which BTC might gain bearish momentum.
Technical indicators:
Hourly MACD – The MACD is now losing pace in the bearish zone.
Hourly RSI (Relative Strength Index) – The RSI for BTC/USD is now below the 50 level.
Major Support Levels – $104,200, followed by $103,500.
Major Resistance Levels – $105,500 and $106,200.
