Ethereum Primed for Explosive Breakout: Broadening Wedge Signals $4,200 Rally Ahead

Ethereum''s chart flashes its most bullish pattern in months—just as Wall Street ''discovers'' crypto again (right on schedule).
The Setup: A textbook broadening wedge—the kind that squeezes shorts into oblivion—has ETH coiled for a potential 30% surge.
Why $4,200 Matters: That price level isn''t just psychological resistance. It''s where derivatives traders piled leveraged longs last cycle before the inevitable ''risk-off'' tweet from a central banker.
Institutional Playbook: Watch for the classic three-act drama: 1) Breakout, 2) Media frenzy about ''institutional adoption,'' 3) Sell-side analysts slapping $10K price targets... right at the local top.
Pro tip: When your Uber driver starts explaining wedge patterns, remember—TA works until everyone sees the same chart.
Ethereum Headed For A Breakout?
In a recent X post, noted crypto analyst Titan of Crypto highlighted that ETH is climbing within a massive weekly broadening wedge structure. The analyst shared the following chart and suggested that ETH could be targeting the $4,200 level – marking the top of the wedge.
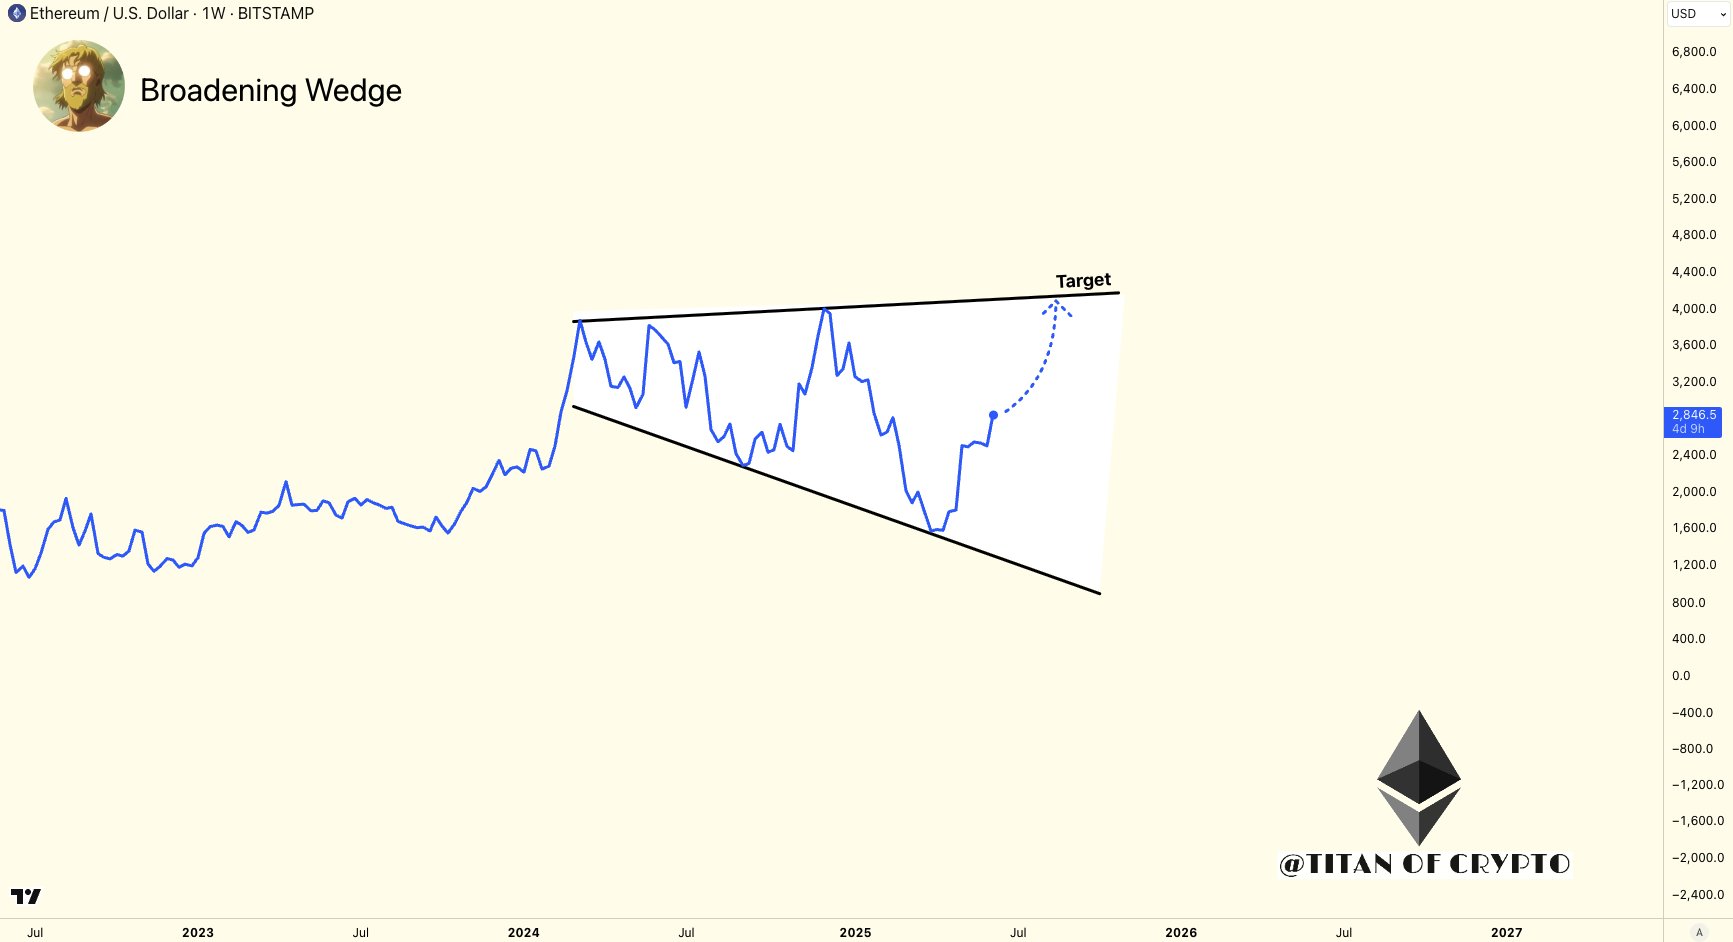
For the uninitiated, a broadening wedge is a chart pattern characterized by diverging trendlines, where price makes higher highs and lower lows, forming a megaphone-like shape. It typically indicates increasing market volatility and can signal a potential breakout, with the direction depending on the prevailing trend and breakout confirmation.
Fellow crypto analyst Master of Crypto echoed a similar outlook, stating that ETH is “setting up for a big move,” especially with over $2.2 billion in short positions clustered NEAR the $3,000 level.
If ethereum breaks above $3,000, it could trigger a short squeeze, potentially accelerating ETH’s rally. At the time of writing, ETH is trading 43.7% below its all-time high (ATH) of $4,878, recorded in November 2021.
Capital flows also indicate rising institutional interest in Ethereum. crypto market commentator Ted Pillows recently pointed out that spot ETH ETFs attracted $240.3 million in inflows yesterday, compared to $164.6 million for spot BTC ETFs.
The stronger performance of ETH ETFs suggests that capital may be rotating from Bitcoin to Ethereum. It’s worth noting that while BTC is up 54% since June 2024, ETH is still down 24.6% during the same period.
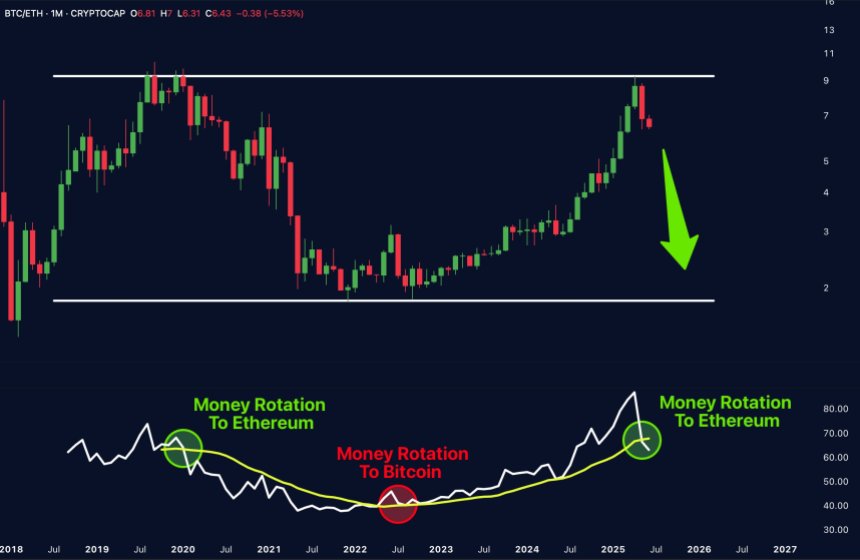
Crypto trader Merlijn the Trader shared the following monthly BTC/ETH chart showing two consecutive red candles, signaling a potential shift in momentum as BTC weakens relative to ETH. The trader noted that a similar capital rotation in 2020 preceded a “monster altseason.”
Things Look Positive For ETH
While altcoins like solana (SOL), Tron (TRX), and SUI created fresh ATHs in 2024, ETH’s performance did not live up to expectations. As a result, the broader sentiment in the Etheruem ecosystem took a hit.
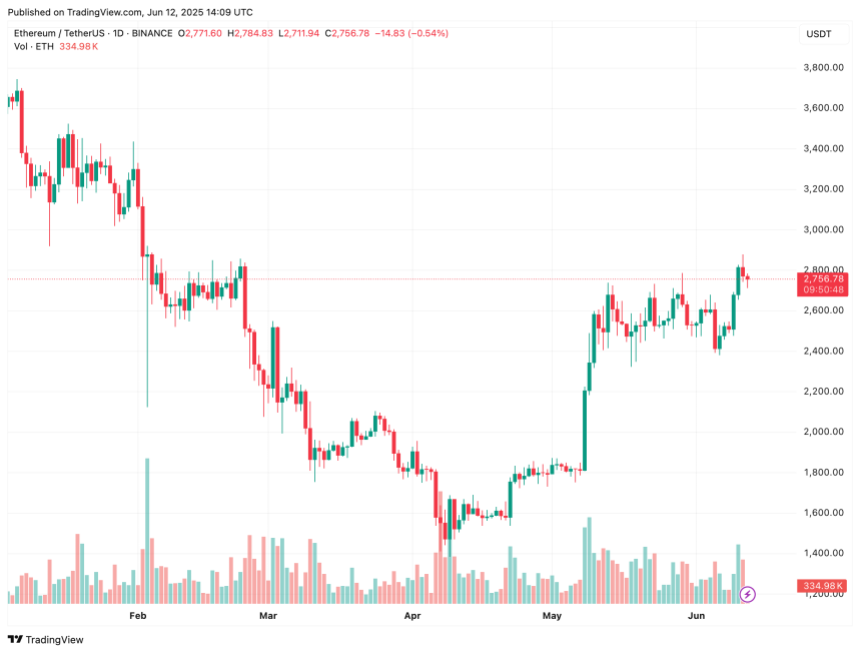
However, 2025 appears to be ushering in a more favorable outlook. On-chain data reveals that ETH faces no major resistance until the $3,417 level.
Additionally, ETH recently flashed a golden cross on the daily chart – a bullish technical signal that could indicate an impending rally. At press time, ETH trades at $2,756, down 1.7% in the past 24 hours.