Bitcoin Plunge: Profit-Taking Triggers Sharpest Correction of 2025—Buy the Dip?

Bitcoin just got a haircut—and traders are scrambling to catch the falling knife. The king of crypto shed 15% in 24 hours as whales cashed out near all-time highs. Here’s why this dip smells more like opportunity than doom.
### Whales Dump, Retail Panics—Same Old Story
Market makers pulled the classic ‘buy the rumor, sell the news’ move after months of bullish momentum. Liquidity vanished faster than a DeFi rug pull when sell orders stacked up.
### Technicals Scream Oversold
RSI levels haven’t been this juicy since the 2023 bear market. The $58K support level (last week’s resistance, naturally) is getting stress-tested—perfect for degenerate leverage traders.
### Wall Street’s ‘I Told You So’ Brigade Is Out
Goldman analysts are probably high-fiving over their ‘volatile asset’ memos right now. Meanwhile, crypto OGs are stacking sats like it’s Black Friday at Coinbase.
This isn’t a crash—it’s crypto’s version of a summer sale. Whether you’re hunting shorts or going long, one thing’s clear: Bitcoin’s heartbeat just got louder.
Bitcoin Price Dips Sharply
Bitcoin price started a fresh decline after it failed to clear the $110,500 resistance zone. BTC declined below the $107,500 and $106,500 support levels.
The price even dipped below the $104,200 support level. Finally, it tested the $103,000 zone. A low was formed at $103,078 and the price is now consolidating losses below the 23.6% Fib level of the recent decline from the $110,273 swing high to the $103,078 low.
Bitcoin is now trading below $105,500 and the 100 hourly Simple moving average. There is also a key bearish trend line forming with resistance at $106,600 on the hourly chart of the BTC/USD pair.
On the upside, immediate resistance is NEAR the $104,200 level. The first key resistance is near the $105,500 level. The next key resistance could be $106,600 and the 50% Fib retracement level of the recent decline from the $110,273 swing high to the $103,078 low.
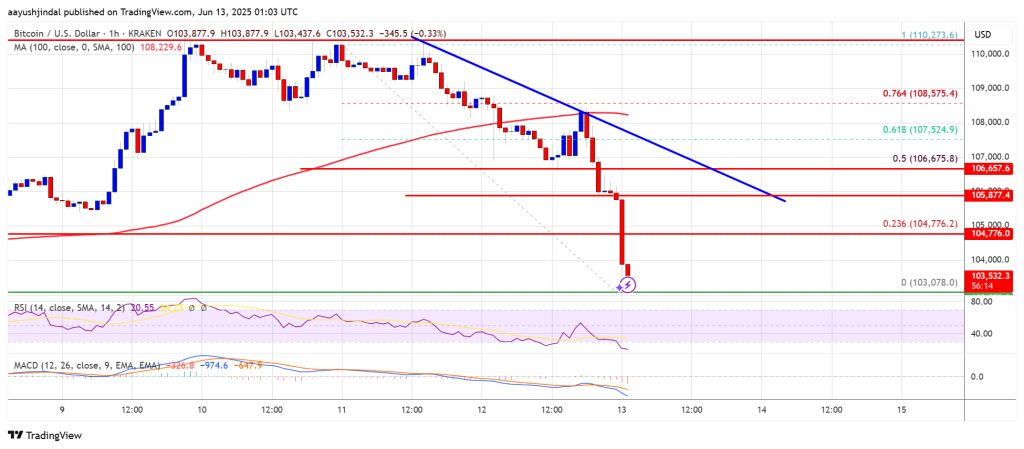
A close above the $106,600 resistance might send the price further higher. In the stated case, the price could rise and test the $108,000 resistance level. Any more gains might send the price toward the $110,000 level.
More Losses In BTC?
If Bitcoin fails to rise above the $105,500 resistance zone, it could start another decline. Immediate support is near the $103,000 level. The first major support is near the $102,350 level.
The next support is now near the $101,500 zone. Any more losses might send the price toward the $100,500 support in the near term. The main support sits at $100,000, below which BTC might gain bearish momentum.
Technical indicators:
Hourly MACD – The MACD is now gaining pace in the bearish zone.
Hourly RSI (Relative Strength Index) – The RSI for BTC/USD is now below the 50 level.
Major Support Levels – $103,000, followed by $102,350.
Major Resistance Levels – $104,200 and $105,500.
