Bitcoin Breaks Resistance—Is This the Run to $100K?

BTC bulls are back in charge as prices surge past key psychological levels. The king of crypto shrugs off macro fears—again.
Technical indicators flash green: RSI climbs while volume spikes suggest institutional FOMO. Even Wall Street's 'risk-off' crowd can't ignore the momentum.
But let's not pop champagne yet. Remember last cycle's 'double top' heartbreak? Traders now eye the $69K ATH like climbers at basecamp—excited, nervous, and secretly calculating exit strategies.
Funny how every 'decentralized' revolution still dances to Fed rate rumors. Maybe Satoshi should've coded a PowellBot into the whitepaper.
Bitcoin Price Gains Pace
Bitcoin price started a fresh increase after it settled above the $103,500 support zone. BTC was able to surpass the $104,400 and $105,000 resistance levels.
The bulls even pumped the price above the $108,000 resistance. A high was formed at $110,550 and the price is now consolidating gains above the 23.6% Fib retracement level of the upward MOVE from the $100,400 swing low to the $110,550 high.
Bitcoin is now trading above $108,000 and the 100 hourly Simple moving average. There is also a bullish trend line forming with support at $106,850 on the hourly chart of the BTC/USD pair.
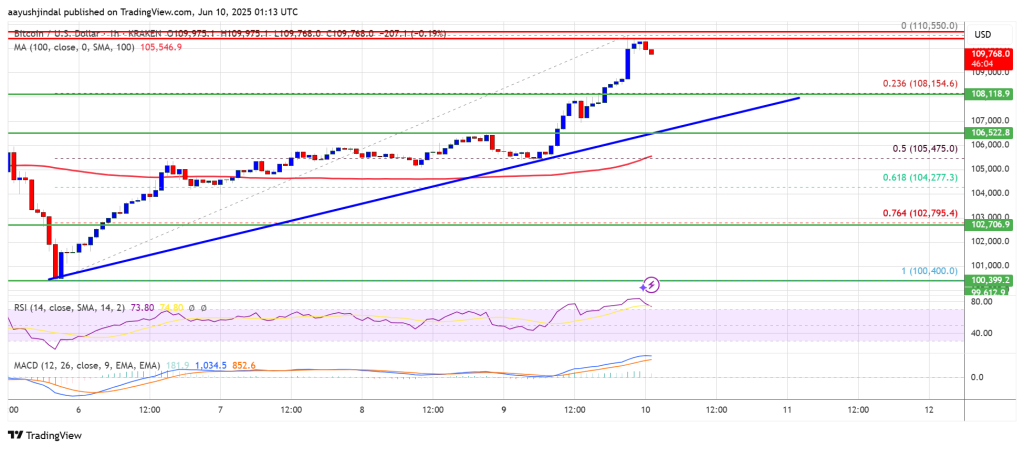
On the upside, immediate resistance is NEAR the $110,000 level. The first key resistance is near the $110,500 level. The next key resistance could be $112,500. A close above the $112,500 resistance might send the price further higher. In the stated case, the price could rise and test the $113,800 resistance level. Any more gains might send the price toward the $115,000 level.
Another Decline In BTC?
If Bitcoin fails to rise above the $110,500 resistance zone, it could start another decline. Immediate support is near the $108,200 level. The first major support is near the $106,500 level and the trend line.
The next support is now near the $105,500 zone and the 50% Fib retracement level of the upward move from the $100,400 swing low to the $110,550 high. Any more losses might send the price toward the $103,500 support in the near term. The main support sits at $102,000, below which BTC might gain bearish momentum.
Technical indicators:
Hourly MACD – The MACD is now gaining pace in the bullish zone.
Hourly RSI (Relative Strength Index) – The RSI for BTC/USD is now above the 50 level.
Major Support Levels – $108,000, followed by $106,500.
Major Resistance Levels – $110,500 and $112,500.

Log in to Reply
Log in to comment your thoughtsComments
Related Articles
|Square
Get the BTCC app to start your crypto journey
Get started today Scan to join our 100M+ users