Bitcoin Smashes Through $105K – Bulls Eyeing a Full Market Revival?

Bitcoin just ripped past $105,000—igniting speculation that the crypto king might be gearing up for another monster rally. After months of sideways action, this breakout has traders dusting off their moon charts.
### The Technical Case for a Comeback
Price action doesn’t lie: breaking six figures signals serious momentum. Liquidity’s flooding back in, and leveraged longs are piling on—classic signs of a market shifting from hibernation to hyperdrive.
### Wall Street’s Late-to-the-Party Dilemma
Meanwhile, institutional desks are scrambling to reposition. Nothing like a 20% weekly pump to make traditional finance regret their "wait-and-see" approach. (Bonus cynicism: Watch hedge funds FOMO in right at the next local top.)
The real question? Whether this is just a dead-cat bounce or the start of crypto’s next leg up. One thing’s certain—volatility’s back on the menu.
Bitcoin Price Restarts Increase
Bitcoin price started a fresh decline and traded below the $102,500 support zone. BTC even traded close to the $100,000 zone before the bulls appeared.
A low was formed and the price recovered above the $103,500 resistance. The bulls even pushed the price above the $105,000 resistance. A high was formed at $106,426 and the price is now consolidating gains above the 23.6% Fib retracement level of the upward MOVE from the $100,400 swing low to the $106,426 high.
Bitcoin is now trading above $105,000 and the 100 hourly Simple moving average. There is also a bullish trend line forming with support at $105,350 on the hourly chart of the BTC/USD pair.
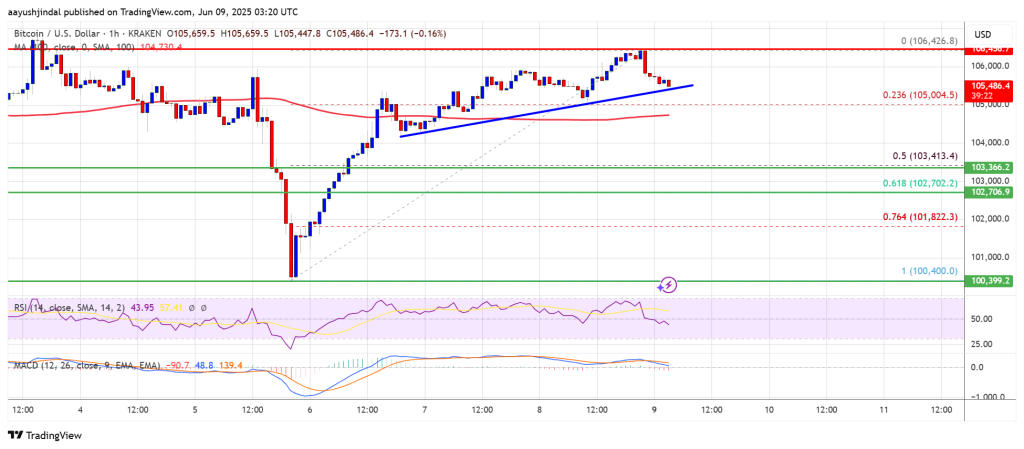
On the upside, immediate resistance is NEAR the $106,200 level. The first key resistance is near the $106,500 level. The next key resistance could be $107,600. A close above the $107,600 resistance might send the price further higher. In the stated case, the price could rise and test the $108,800 resistance level. Any more gains might send the price toward the $110,000 level.
Another Decline In BTC?
If Bitcoin fails to rise above the $106,200 resistance zone, it could start another decline. Immediate support is near the $105,200 level and the trend line. The first major support is near the $103,500 level and the 50% Fib retracement level of the upward move from the $100,400 swing low to the $106,426 high.
The next support is now near the $102,000 zone. Any more losses might send the price toward the $100,500 support in the near term. The main support sits at $100,000, below which BTC might gain bearish momentum.
Technical indicators:
Hourly MACD – The MACD is now gaining pace in the bullish zone.
Hourly RSI (Relative Strength Index) – The RSI for BTC/USD is now above the 50 level.
Major Support Levels – $105,200, followed by $103,500.
Major Resistance Levels – $106,200 and $107,600.
