Ethereum Whales Return—And This Time, the Charts Scream Bull Run

Big money is flooding back into Ethereum—and the technicals suggest this isn’t just another false dawn. Whale wallets are loading up, network activity’s ticking higher, and the charts? They’re painting the most bullish picture since the last cycle’s euphoria.
Forget ’quiet accumulation.’ This is a full-blown resurgence. On-chain data shows whales snapping up ETH at levels not seen since the 2021 mania—back when your Uber driver had a DeFi portfolio.
Key indicators flashing green:
- Whale transaction volume spikes: 47% month-over-month surge in large transfers
- Exchange reserves draining: Over 800K ETH pulled from custodial wallets in Q2
- Derivatives heating up: Open interest hits 18-month highs as leverage traders pile in
The kicker? This rally’s got fundamentals behind it—Ethereum’s fee-burning mechanism is now destroying $20M+ daily. Try finding that kind of deflationary pressure in the Fed’s playbook.
Of course, Wall Street will claim they saw it coming—right after they finish downgrading their price targets. For now, the blockchain doesn’t lie: the smart money’s betting big on ETH’s next leg up.
Ethereum Flashes Bullish Setup Not Seen Since 2020
On the monthly ETH-USD chart, Kevin begins by zooming out to the monthly ETH-USD chart. The price, he reminds viewers, has “done nothing but trade in a massive range” ever since April 2021, masking the kind of compression that often precedes violent expansion. The tell-tale turn, in his view, came this April when Ethereum wicked into the $1,400 area only to reverse and close with a candle he labels a “massive demand candle.”
That pattern, he notes, has appeared only twice before on a monthly ETH chart—each time after a major correction and each time followed by sustained upside. The May candle delivered confirmation: a 41% body that lifted price back above the long-term super-trend, an area many technicians had already written off as “guaranteed to break.”
What makes the structure “so historical,” Kevin argues, is the alignment of high-momentum indicators that rarely fire together. The monthly stochastic RSI is about to execute what he calls a “V-shaped cross” out of oversold territory; the last clean cross marked the 2020 macro bottom.
The MACD histogram, meanwhile, has been compressing into what he likens to a symmetrical triangle that has taken four years to complete, signalling “coiled energy” that can only resolve in a large directional move. Even on-chain money-flow readings, he says, are “tied for the lowest level in history—but already reversing,” implying that deep-pocketed holders have begun to accumulate while retail sentiment remains subdued.
Kevin then pivots to the dominance metrics that, in his framework, dictate whether a MOVE in Ethereum can spill over into the broader altcoin market. On Ethereum-dominance he pulls up Heikin-Ashi candles to show the first green print in more than a year exactly at the zone that formed the 2019–20 base. “We’re at the same spot ETH dominance bottomed in 2019,” he says, pointing to a series of demand candles that mirror the pre-bull-run pattern of the last cycle.
A Market Cipher buy signal has just appeared, the VWAP has crossed the zero line, and money FLOW is curling up from all-time-low depths. In Kevin’s view, the implication is clear: “Whales are starting to accumulate, and nobody is paying attention.”
The ETH/BTC ratio completes the trifecta. Here Kevin shows the pair tagging the 0.5 Fibonacci retracement of the entire 2020-21 advance, printing its own demand candles and flipping green on the Heikin-Ashi readout. More striking to him is the monthly stochastic RSI, which has spent 1,066 days—almost three full years—below the 20 threshold that traditionally marks bear-market exhaustion. “It’s game time,” he declares. “This thing is getting ready to cross back up, and the negativity on ETH is happening right under everyone’s nose.”
Underlying the technical case is a macro backdrop Kevin believes is becoming incrementally supportive. “You don’t actually need the Fed to cut,” he tells viewers. “We just need guidance—looser policy on the horizon, decent inflation prints—and Ethereum will do the rest.”
Historically, he argues, a decisive rotation in ETH has been the trigger for what he calls “durable altcoin outperformance,” because it signals that risk capital is migrating down the market-cap spectrum. In that sense, a true Ethereum breakout is less a single-asset story than a signal for an entire sector.
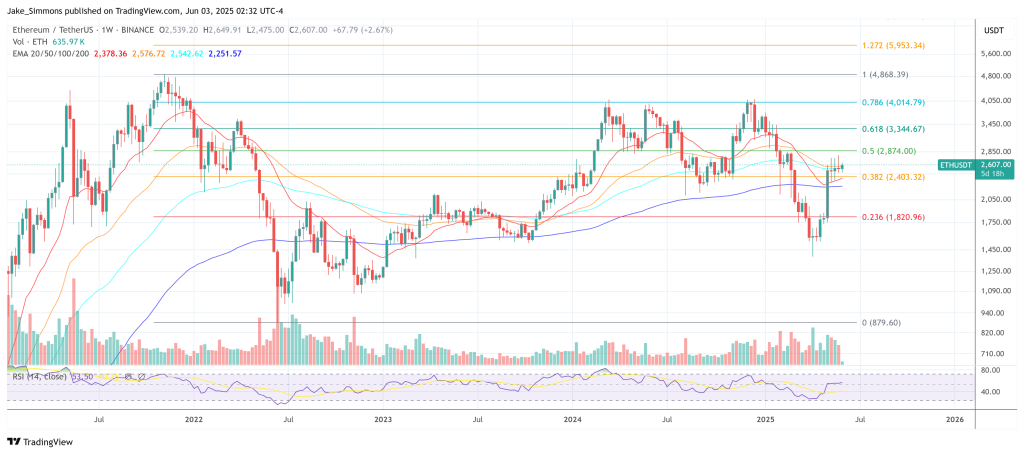
Sceptics will note that Ethereum still faces heavy resistance in the $2,800–3,000 zone and that previous rallies have stalled at that ceiling. Kevin concedes the level is critical but insists the weight of monthly signals makes a sustained breach increasingly likely. “These are monthly timeframes,” he cautions. “They don’t play out overnight, but the evidence says the multi-year bear market in ETH-BTC is ending.”
At press time, ETH traded at $2,607.