Bitcoin Price Teeters on Edge of Explosive Breakout—Here’s the Line in the Sand

Forget moon shots—Bitcoin’s gunning for the fruit bowl. A top analyst warns the king of crypto could go ‘bananas’ if it clears one critical price level.
The Magic Number Everyone’s Watching
No fancy jargon here: Close above *this* line, and the bulls start swinging. Miss it? Another day in volatility purgatory.
Wall Street’s Watching (Between Sips of $20 Coffee)
Traditional finance types still pretend they ‘don’t get’ crypto—right up until their algos front-run the rally. Funny how that works.
One thing’s clear: When Bitcoin moves, it doesn’t care about your feelings—or your leveraged positions.
Bitcoin Has Been Following In Gold’s Footsteps on 2-Day Timeframe
Last year, Capriole Investments founder Charles Edwards shared in an X post how bitcoin was following the same structure as the Gold all-time high (ATH). Below is the chart that the analyst posted back then.
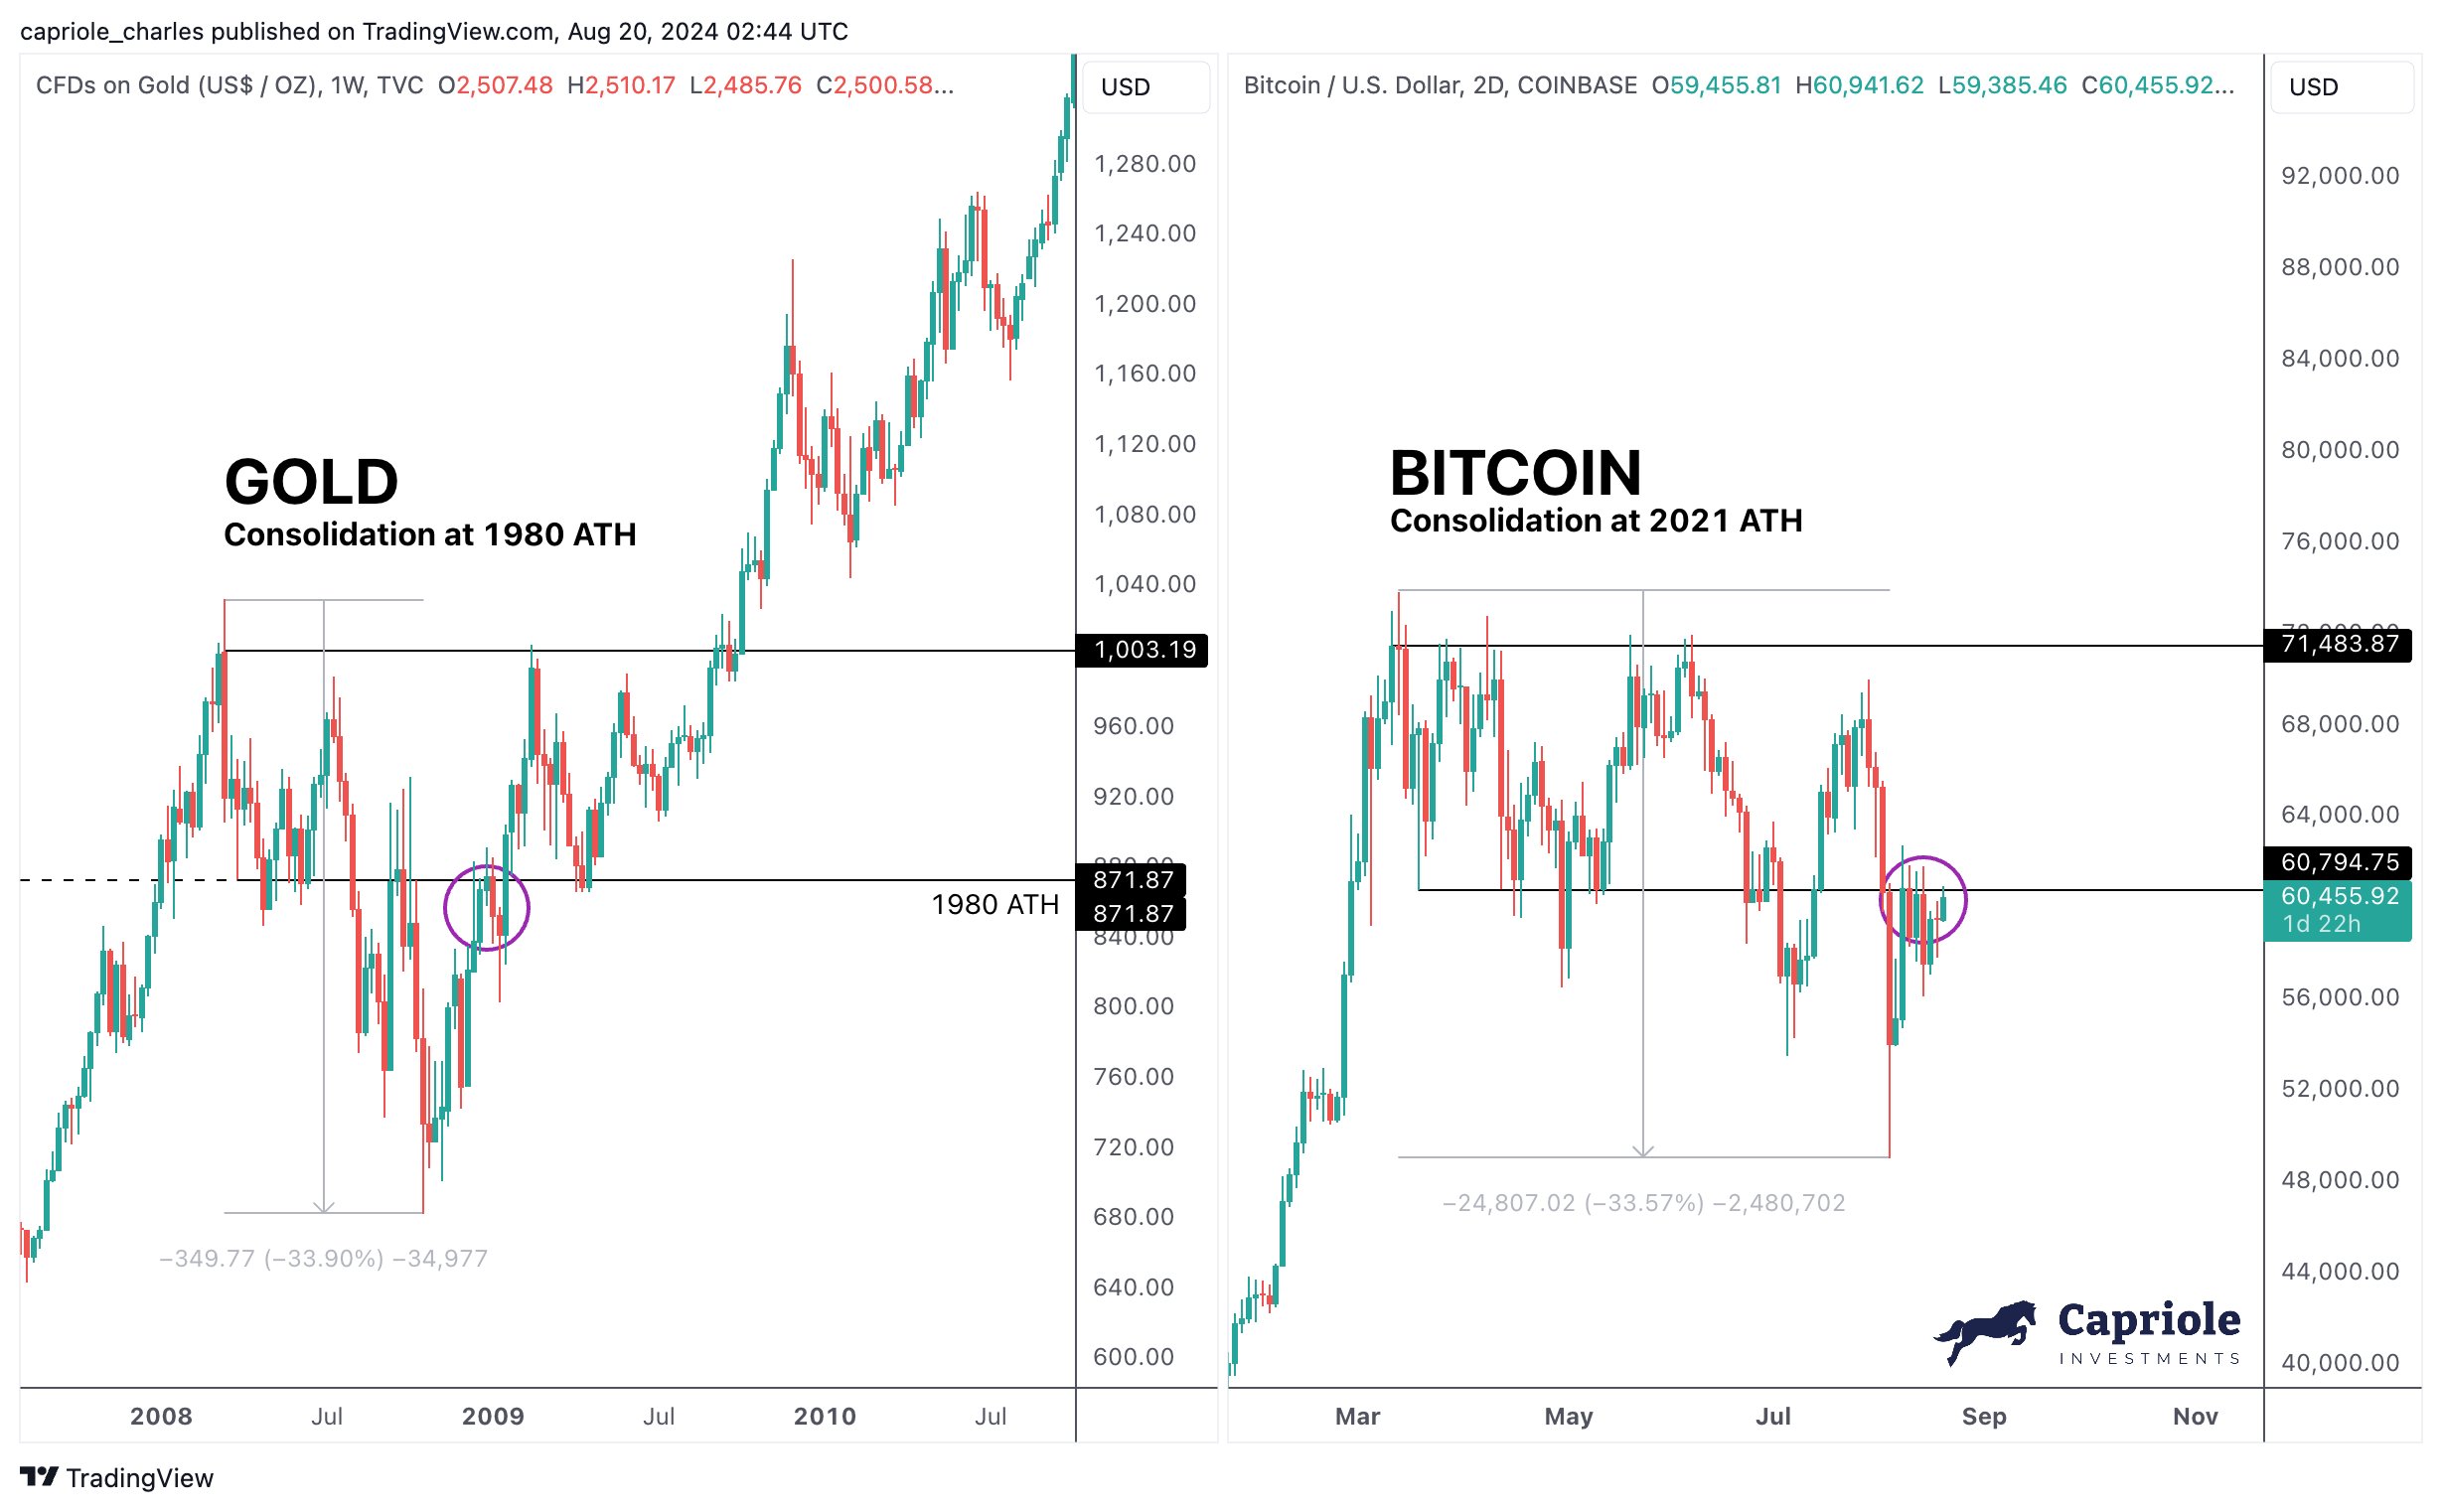
From the graph, it’s visible that BTC was consolidating at its 2021 ATH in a manner similar to Gold’s movement around the 1980 ATH. The latter’s consolidation ended with it breaking out and rallying to a point two times higher.
In a new post, Edwards has shared a late update on how things ended up playing out for Bitcoin.
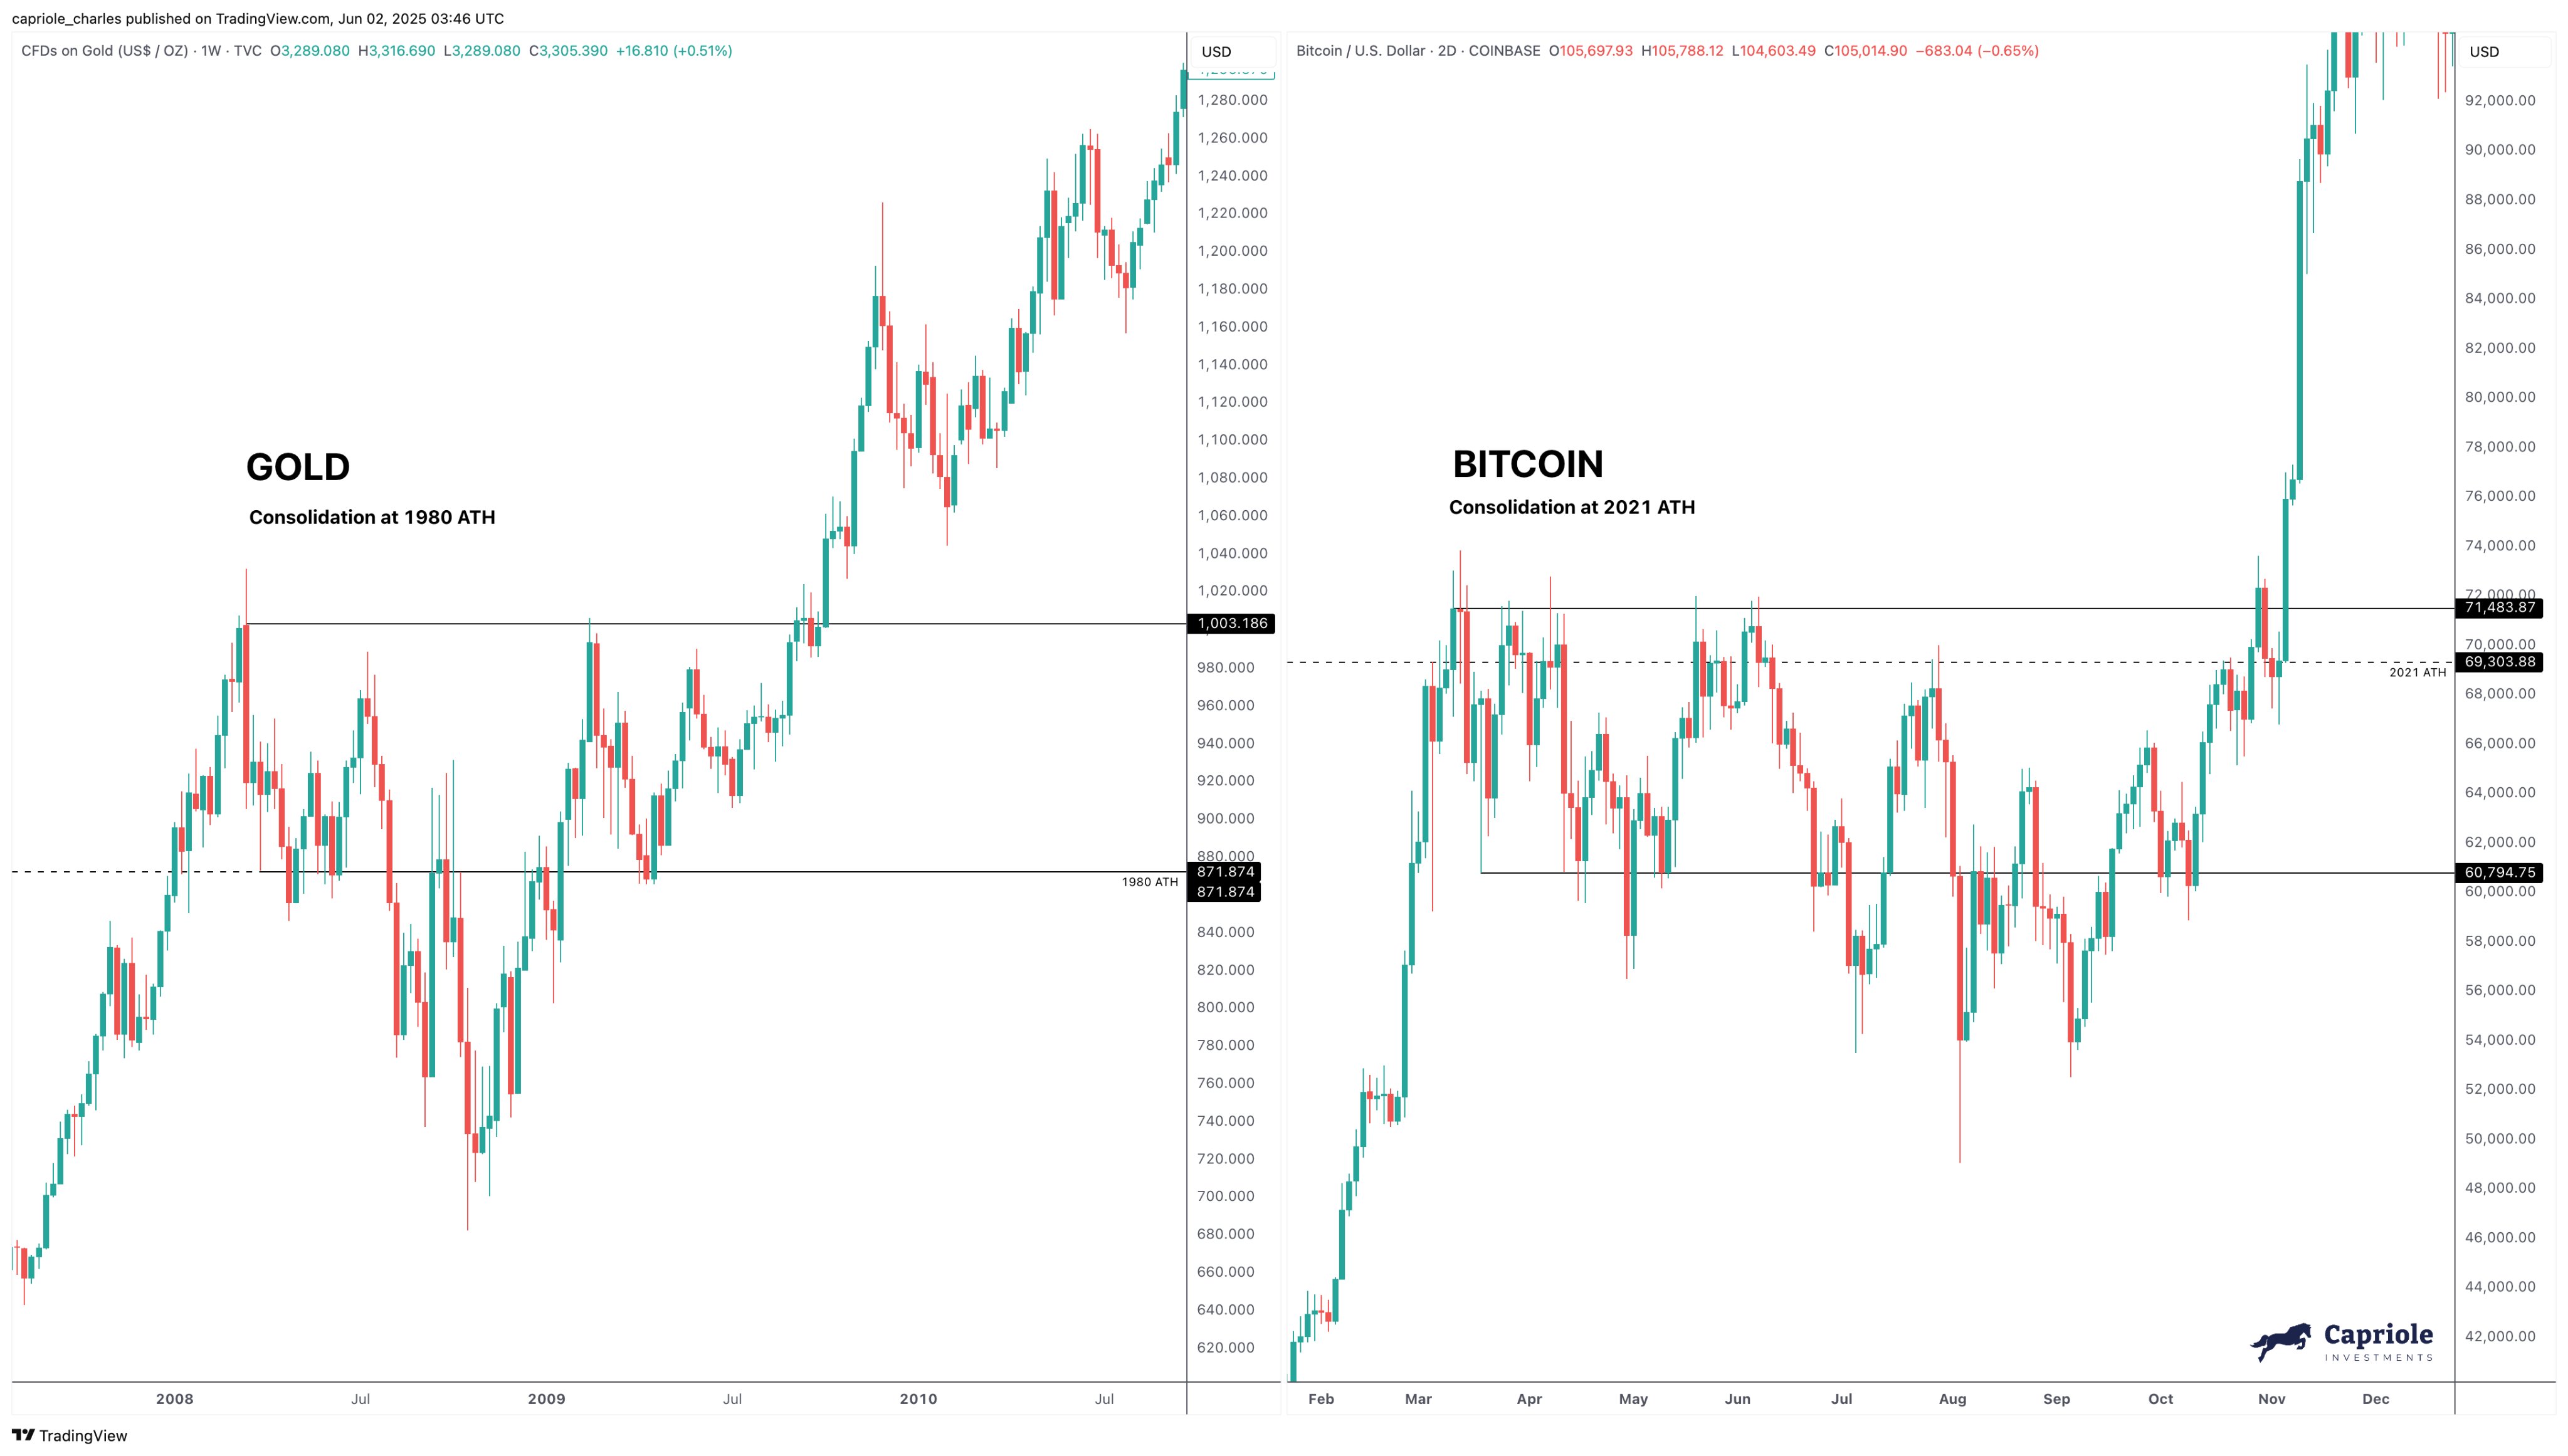
As the consolidation around the respective ATHs already hinted, there indeed ended up being some similarity between the breakouts for the prices of the two assets as well.
But this is all in the past, where does the latest Bitcoin price action stack up against Gold? Here is another chart posted by the analyst, highlighting the point BTC is currently at:
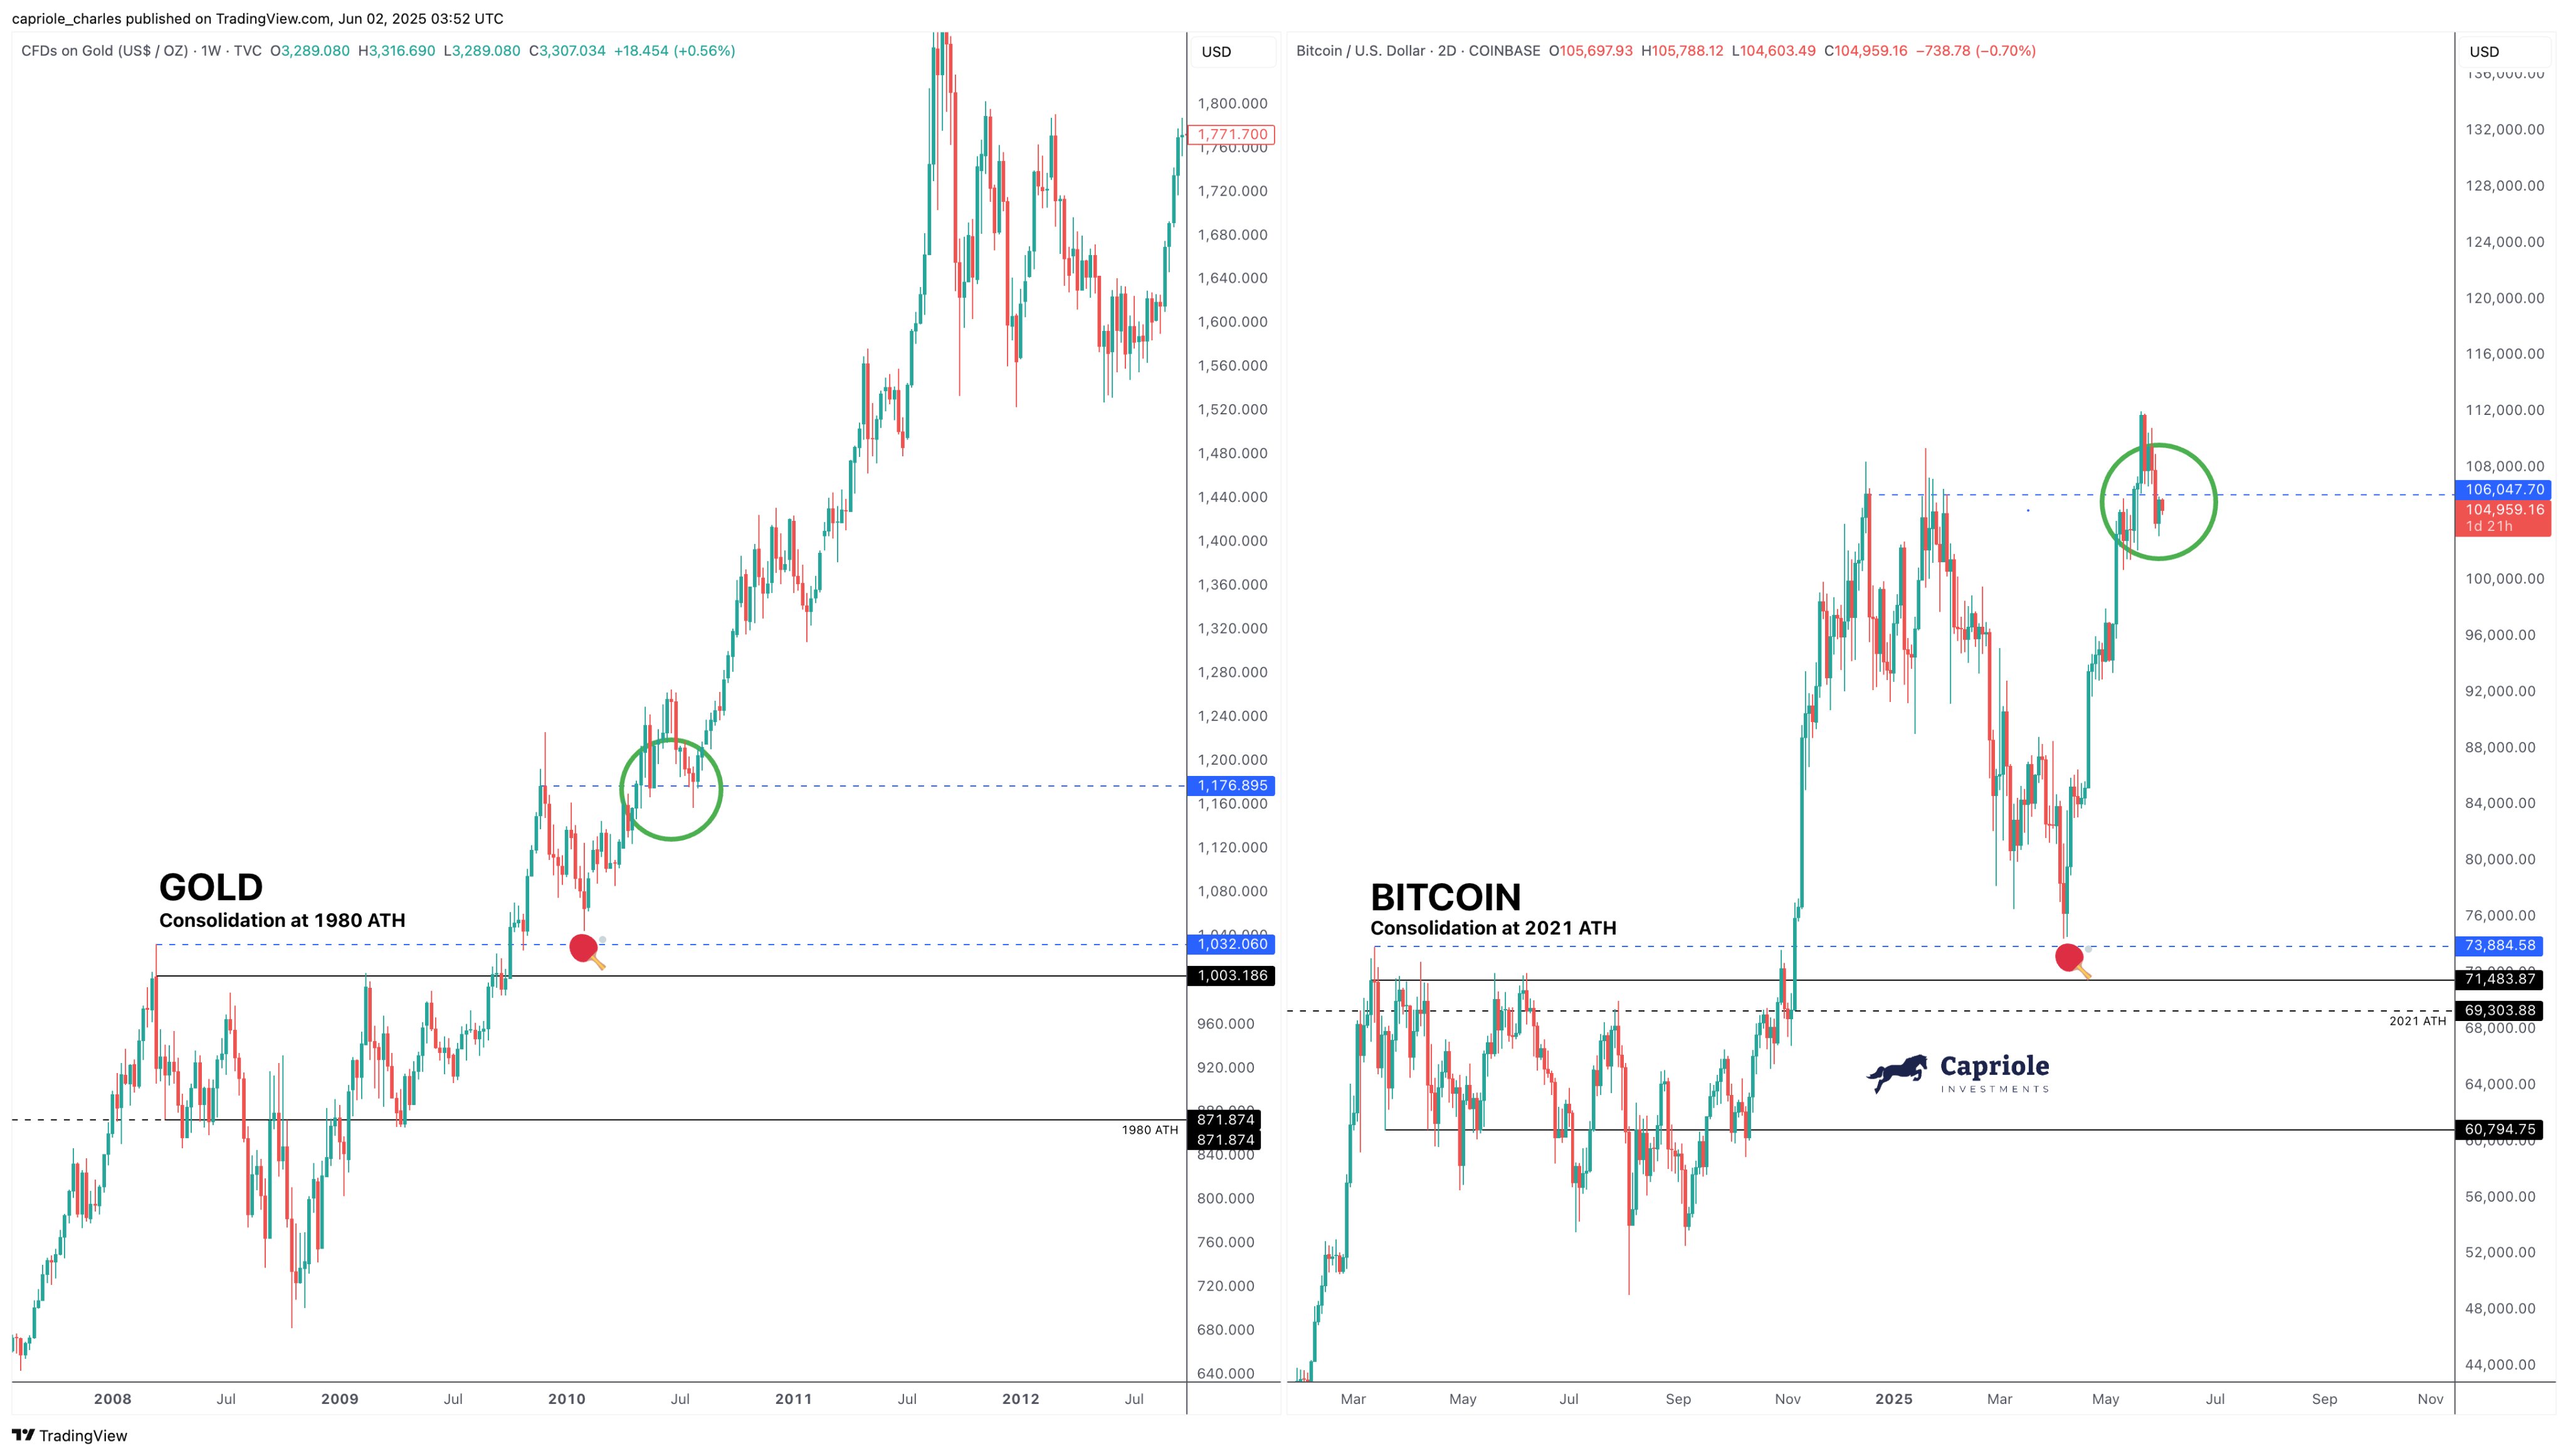
As Edwards has highlighted in the graph, BTC’s breakout since the consolidation phase around the ATH has continued to resemble Gold’s, except for the fact that BTC’s volatility has been roughly twice as high, in terms of both upward and downward moves.
That said, the cryptocurrency’s latest close has looked less promising than what the precious metal displayed at a similar stage in its structure. It’s possible that the two could diverge from here, but in the case that they don’t, Gold’s path may provide a glimpse into what could lie ahead for the coin.
As is apparent from the chart, the traditional safe-haven asset saw a significant surge from this point. Based on this, the analyst has noted, “close back above $110K and this will probably go bananas.” It now remains to be seen how things WOULD play out for Bitcoin in the near future.
In some other news, the institutional DeFi solutions provider Sentora has shared data related to how the cryptocurrency’s supply is currently distributed among the various segments of the sector.

It would appear the individual investors control around 69.4% of the total potential Bitcoin supply. The ETFs and other funds own around 6.1%, while businesses about 4.4%. About 7.5% of all BTC that there ever will be has already been lost due to missing keys and/or being forgotten.
BTC Price
At the time of writing, Bitcoin is trading around $104,200, down more than 4% in the last week.
