XRP’s Make-or-Break Moment: Wave Count Analysis Pinpoints the Launchpad Price

Forget hopium—here’s the hard math. XRP’s next bull run hinges on hitting one critical price level, according to Elliott Wave theorists. When it flips this key resistance? Strap in.
The Trigger Point: No Magic, Just Charts
Technical analysts are glued to the 3-wave corrective pattern playing out since 2024’s SEC settlement. The breakout signal? A clean close above $0.92—the 0.618 Fibonacci retracement of the 2021 crash. Miss that, and we’re stuck in accumulation purgatory.
Why Traders Should Care
Volume’s drying up faster than a DeFi project’s treasury reserves. Either whales step in at this level, or XRP risks another 18-month sideways grind—because nothing screams ’adoption’ like watching paint dry on a 5-year chart.
One hedge fund quant put it best: ’Crypto doesn’t need fundamentals when you’ve got leverage and a dream.’ XRP’s about to test that thesis—again.
XRP Price Primed For Major Lift-Off From This Level
A new analysis published by crypto analyst the ‘Charting Prodigy’ on X (formerly Twitter) suggests that the XRP price is following a clear Elliott Wave structure that began forming after the April lows this year. The price has completed Wave 1 of a new impulse cycle, followed by a WXY corrective Wave 2.
Recent price action also indicates that XRP is now entering sub-wave 3 of Macro Wave 5, which is typically the most powerful and extended wave in the cycle. The standout detail of Charting Prodigy’s analysis is the identified trigger level at $2.56.
According to the expert’s analysis, a confirmed breakout above this critical trigger point could signal the start of a rapid markup phase, potentially propelling XRP toward the $2.9 to $3.4 range. The significance of this bullish target is supported by not only the Elliott Wave analysis but also the Wyckoff reaccumulation, Fibonacci extension targets, and the emergence of a bullish divergence forming on the Moving Average Convergence Divergence (MACD).
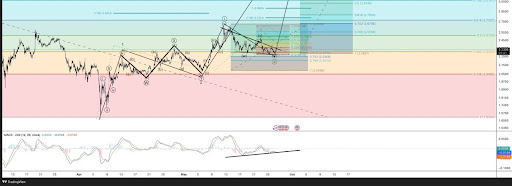
Notably, the analyst points to a classic Wyckoff accumulation structure taking shape on the XRP price chart. He identified key phases such as Preliminary Support (PSY), Automatic Rally (AR), and Secondary Test (ST). The structure also included a “spring” phase and, most recently, a Last Point of Support (LPS).
The emergence of these Wyckoff elements suggests that XRP has completed its reaccumulation and has entered the aforementioned markup phase, where price tends to go parabolic. The combination of these technical indicators and chart patterns also indicates that $2.65 is the level to watch as XRP makes its way up to price levels close to its former ATH.
XRP Set For Double-Digit Target In 2 Weeks
According to a new chart analysis by crypto analyst Egrag Crypto, XRP may be on the verge of a historic breakout. Presenting a 2-week price chart, the analyst highlights a macro bullish formation that could push XRP into double-digit territory—targeting $10, $18, $27, and even a whopping $55 in the months ahead.
Egrag Crypto’s chart draws attention to a long-standing macro ascending channel that XRP has respected since 2016. Past breakouts from similar setups have historically delivered exponential gains for the cryptocurrency.
The key trigger, according to the analysis, is a decisive MOVE above the 21-week timeframe. This same signal preceded XRP’s explosive rally in 2017 when it surged from under 1 cent to an all-time high of $3.84. Notably, the analysis emphasizes the importance of remaining within this macro ascending channel, indicating that as long as the lower trendline holds and the 21 EMA is breached, XRP’s bullish case remains intact.
