Solana’s SOL Tumbles Again—Will the Bulls Finally Step In?

Solana’s native token SOL keeps bleeding—down another 12% this week as the broader crypto market wobbles. Traders are split: Is this a fire sale or a falling knife?
Technical indicators scream oversold, but macro headwinds (thanks, Fed) aren’t helping. Meanwhile, Ethereum ETF approvals stole Solana’s thunder—classic ’narrative rotation’ at work.
Silver lining? Network activity holds steady. Over 2,500 daily active dApps suggest real usage beneath the price chaos. And let’s be honest—after surviving the FTX implosion, SOL’s developers have a PhD in crisis management.
Bottom line: Crypto’s ’speed chain’ needs a catalyst. Either institutional money wakes up to Solana’s tech, or we’re looking at another ’buy the rumor, sell the news’ special—Wall Street’s favorite party trick.
Solana Price Dips Again
Solana price failed to continue higher above the $172 level and started a fresh decline, like Bitcoin and Ethereum. SOL gained pace and traded below the $160 support level.
The price even traded below the $155 level. A low was formed NEAR $150 and the price recently started a recovery wave. There was a move above the $155 level. It surpassed the 23.6% Fib retracement level of the recent decline from the $180 swing high to the $150 low.
Solana is now trading below $160 and the 100-hourly simple moving average. There is also a key bearish trend line forming with resistance at $160 on the hourly chart of the SOL/USD pair.
On the upside, the price is facing resistance near the $160 level and the trend line. The next major resistance is near the $165 level. It is close to the 50% Fib retracement level of the recent decline from the $180 swing high to the $150 low.
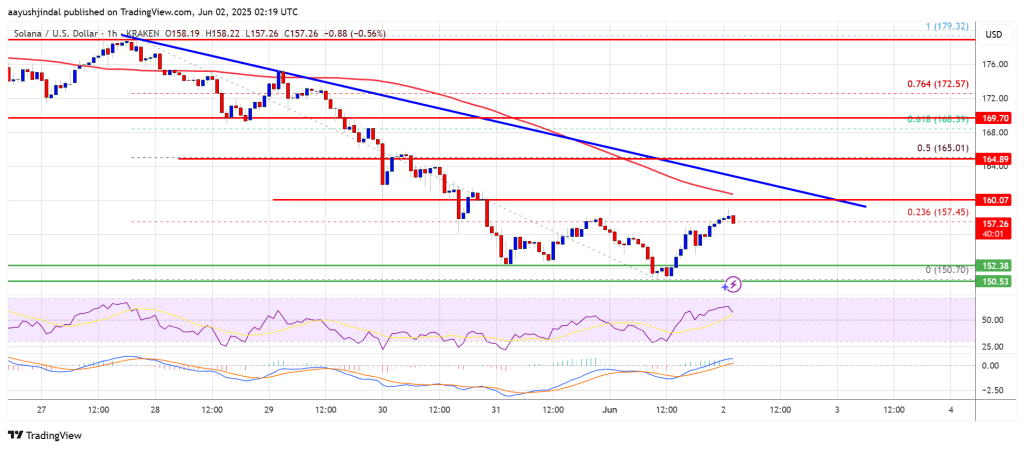
The main resistance could be $170. A successful close above the $170 resistance zone could set the pace for another steady increase. The next key resistance is $172. Any more gains might send the price toward the $180 level.
Another Decline in SOL?
If SOL fails to rise above the $160 resistance, it could start another decline. Initial support on the downside is near the $155 zone. The first major support is near the $152 level.
A break below the $152 level might send the price toward the $145 zone. If there is a close below the $145 support, the price could decline toward the $132 support in the near term.
Technical Indicators
Hourly MACD – The MACD for SOL/USD is gaining pace in the bearish zone.
Hourly Hours RSI (Relative Strength Index) – The RSI for SOL/USD is below the 50 level.
Major Support Levels – $155 and $152.
Major Resistance Levels – $160 and $162.

Log in to Reply
Log in to comment your thoughtsComments
Related Articles
|Square
Get the BTCC app to start your crypto journey
Get started today Scan to join our 100M+ users