Bitcoin Primed for Breakout — Are Bulls About to Charge?

Bitcoin’s price action hints at another rally—just as Wall Street ’experts’ finish revising their doom-and-gloom predictions upward.
The crypto king flirts with key resistance levels, teasing traders with the prospect of fresh highs. Liquidity pools cluster just above current prices, suggesting whales are loading up before the next leg up.
Meanwhile, traditional finance scrambles to justify why they called it a ’bubble’ at $30K. Spoiler: FOMO beats fundamentals every time.
Bitcoin Price Eyes Upside Break
Bitcoin price started a fresh decline and traded below the $106,500 support zone. BTC even traded below the $105,500 level and tested the next support at $103,200.
A low was formed at $103,200 and the price is now consolidating losses. There was a MOVE above the $104,200 level and the 23.6% Fib retracement level of the recent decline from the $110,500 swing high to the $103,200 low.
Bitcoin is now trading above $105,000 and the 100 hourly Simple moving average. On the upside, immediate resistance is NEAR the $105,550 level. There is also a key bearish trend line forming with resistance at $105,550 on the hourly chart of the BTC/USD pair.
The first key resistance is near the $106,000 level. The next key resistance could be $106,800. It is close to the 50% Fib retracement level of the recent decline from the $110,500 swing high to the $103,200 low.
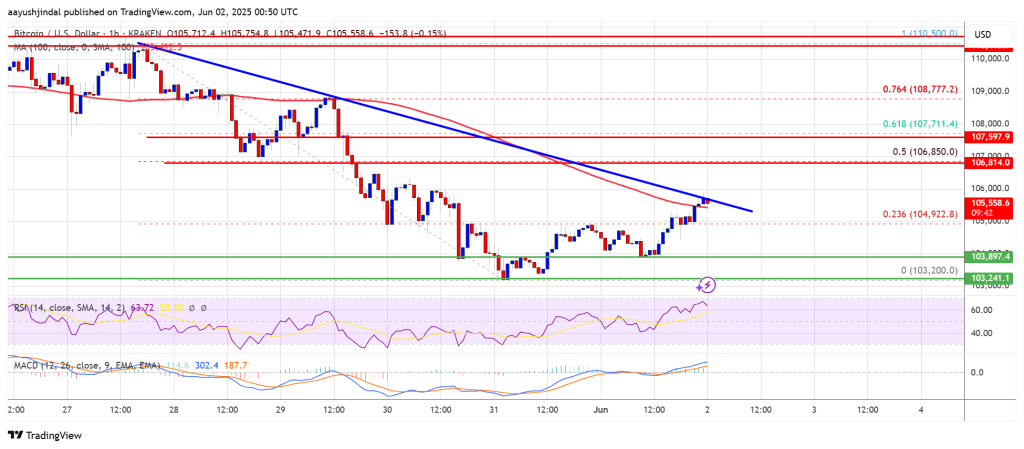
A close above the $106,800 resistance might send the price further higher. In the stated case, the price could rise and test the $108,000 resistance level. Any more gains might send the price toward the $110,000 level.
Another Drop In BTC?
If Bitcoin fails to rise above the $106,000 resistance zone, it could start another decline. Immediate support is near the $105,000 level. The first major support is near the $104,200 level.
The next support is now near the $103,200 zone. Any more losses might send the price toward the $102,500 support in the near term. The main support sits at $101,200, below which BTC might gain bearish momentum.
Technical indicators:
Hourly MACD – The MACD is now gaining pace in the bullish zone.
Hourly RSI (Relative Strength Index) – The RSI for BTC/USD is now above the 50 level.
Major Support Levels – $105,000, followed by $104,200.
Major Resistance Levels – $106,000 and $106,800.
