Bitcoin’s $93K Dream in Jeopardy? Charts Flash Warning Signs

Technical indicators are throwing shade on Bitcoin’s rally—could the road to $93K be a dead end?
RSI divergence and weakening volume suggest the bulls might be running out of steam. Meanwhile, futures traders keep levering up like it’s 2021 all over again.
Key support levels to watch: if BTC can’t hold $60K this week, the ’buy the dip’ crowd might finally get the discount they’ve been pretending to want.
Funny how the same analysts who called for six-figure Bitcoin now whisper about ’healthy corrections’—Wall Street’s playbook works just fine in crypto, apparently.
Which Technical Indicators Are Sounding The Sell Alarm?
In a May 30 post on the X platform, crypto analyst Burak Kesmeci provided a technical insight into the price of Bitcoin, explaining that signs are quickly turning bearish for the flagship cryptocurrency. The online pundit projected that BTC could face a severe price downturn to around the $93,000 level in the near future.
Kesmeci highlighted changes in some technical indicators on the daily timeframe, suggesting that a correction might be on the horizon for the Bitcoin price. One of these indicators is the daily Relative Strength Index (RSI), a momentum indicator that estimates the speed and magnitude of an asset’s price movements.
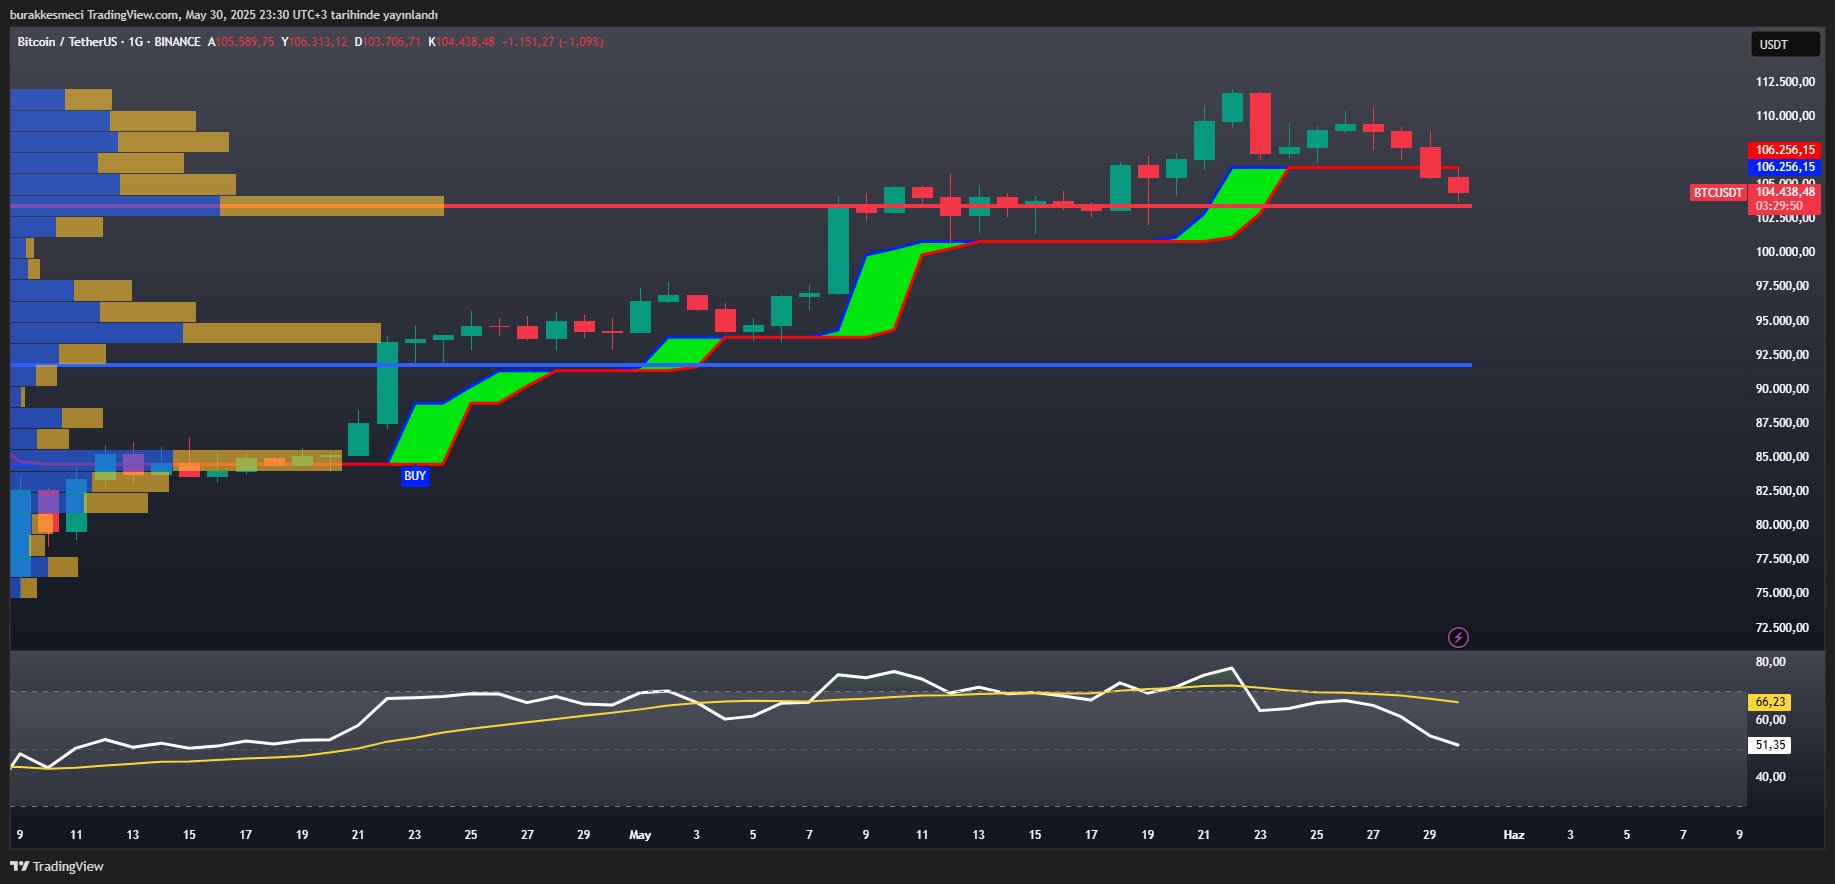
As observed in the chart above, the daily RSI is around 51 points and below the 14-day simple moving average (SMA). According to the crypto analyst, this technical indicator shift points to a weakening bullish momentum for the bitcoin price.
Kesmeci also noted that the Fixed Range Volume Profile (FRVP), which analyzes trading volume around a price region, signals a heavy trading zone around the $103,500 level. A sustained close beneath this level could lead to elevated selling pressure for the flagship cryptocurrency, the analyst said.
Furthermore, Kesmeci mentioned that the AlphaTrend indicates that a second close below 106.269 may trigger a “sell” signal for the Bitcoin price. Meanwhile, the Average Directional Index (ADX) suggests that the bears are gaining the upper hand in the market.
Finally, Kesmeci pinpointed the next target at the 0.5 Fibonnaci level and the FRVP Value Area Low (VAL), both of which could be considered major support zones, at around $93,000 and $91,800, respectively. Ultimately, all these technical levels suggest that the bitcoin price may correct to the $91,000 – $93,000 bracket.
Bitcoin Price At A Glance
As of this writing, the price of BTC is hovering around the $104,000 mark, reflecting an almost 2% decline in the past 24 hours.

Log in to Reply
Log in to comment your thoughtsComments
Related Articles
|Square
Get the BTCC app to start your crypto journey
Get started today Scan to join our 100M+ users