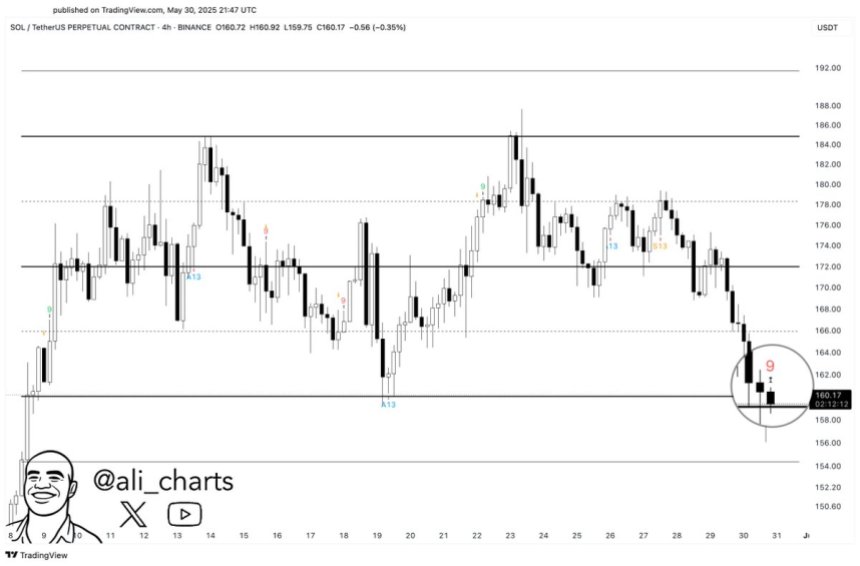
Solana Triggers Buy Signal – Can It Defend the $159 Line for a Comeback?

Solana’s charts just flashed a bullish signal—but the real test is whether it can hold the $159 support level. Traders are watching this key threshold like hawks, knowing a bounce here could spark the next leg up.
Technical indicators suggest accumulation, yet market veterans know these signals can be fickle. Remember when everyone swore that ’this time it’s different’ during the last bull run? Yeah, that aged like milk left in a crypto miner’s basement.
All eyes on SOL’s price action now—break below $159, and the bulls might need more than hopium to salvage this trade.
Solana Consolidates Quietly
While much of the market’s attention remains locked on Bitcoin and Ethereum, Solana has been quietly consolidating in a tight range below the $180 resistance. The lack of volatility in recent days may seem uneventful, but analysts warn that this calm could be the precursor to a sharp breakout.
As the broader market digests macroeconomic uncertainty and prepares for a potential altseason, Solana’s technical setup suggests it may be one of the first major altcoins to move.
Martinez recently shared an optimistic outlook for Solana, highlighting the importance of the $159 support level. As long as SOL holds this zone, the structure remains bullish. Martinez also noted that the TD Sequential indicator has flashed a buy signal on the chart, typically seen during the final stages of a retracement before a new impulse begins. This aligns with the current low-volume, sideways environment that often precedes large price expansions.
If Solana breaks above the $180 resistance with strong momentum, the MOVE could spark an aggressive rally toward previous highs. Given its strong fundamentals, vibrant ecosystem, and historical leadership during bullish phases, Solana is well-positioned to lead if the market transitions into a full-fledged altseason.
Solana Tests Support As Market Corrects
Solana (SOL) is currently trading around $153.49 after failing to reclaim the $180 resistance zone. The daily chart shows a sharp decline over the past few sessions, with price breaking below the 34-day EMA at $163.20. This move highlights growing bearish momentum and places the spotlight on the $150–$156 support range, where the 50-day and 100-day SMAs converge.
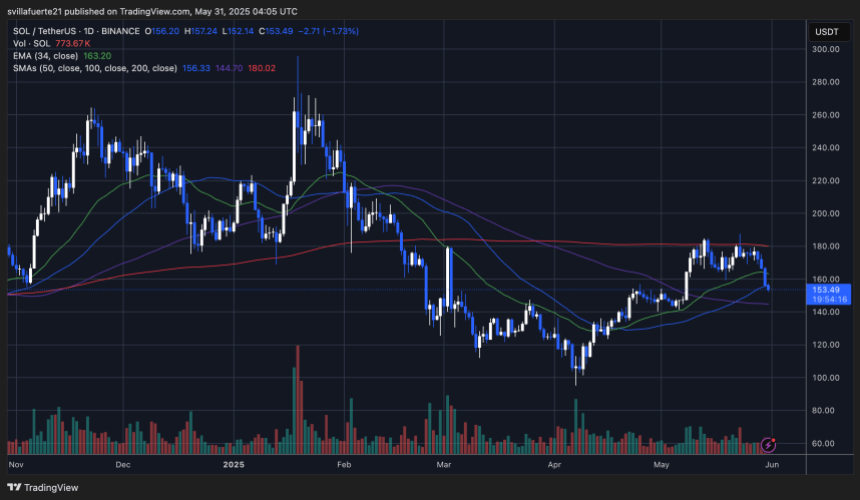
Volume has ticked higher during this drop, suggesting stronger selling pressure as traders de-risk amid broader market uncertainty. The failure to hold above key moving averages weakens the short-term bullish outlook, though the structure hasn’t fully broken down yet. If SOL manages to stabilize above $150, this zone could act as a base for a rebound.
However, continued weakness below this level may lead to a retest of lower support zones around $144 and $135. That said, RSI levels suggest Solana is approaching oversold territory on lower time frames, hinting that buyers could step in soon.
For a bullish reversal, SOL needs to reclaim the $163 level and push above the $180 resistance. Until then, traders should watch the $150–$159 range closely, as holding this zone is critical for Solana’s next leg in either direction.
Featured image from Dall-E, chart from TradingView

Log in to Reply
Log in to comment your thoughtsComments
Related Articles
|Square
Get the BTCC app to start your crypto journey
Get started today Scan to join our 100M+ users