Bitcoin Braces for Steep Correction After Topping $111K—Analysts Warn of Bearish Storm Clouds

Just weeks after notching a staggering $111,000 all-time high, Bitcoin faces mounting downward pressure as analysts flag warning signs. The crypto king’s throne looks shakier than a leveraged trader’s portfolio during a flash crash.
Market watchers point to weakening momentum indicators and overheated derivatives markets—classic hallmarks of a looming pullback. ‘This isn’t FUD, just math,’ quips one strategist while adjusting their short position.
Retail euphoria has hit levels last seen before major corrections, with open interest screaming ‘overbought’ across exchanges. Meanwhile, institutional flows show early signs of fatigue—because nothing kills a rally faster than Wall Street taking profits.
Whether this proves a healthy reset or the start of something uglier depends on how quickly BTC finds support. One thing’s certain: in crypto, the only ‘stable’ coin is the one pegged to fiat—and even that’s debatable.
Resistance Rejects Again With Double Top Risk
The analyst behind the TradingView post highlighted the clear rejection pattern near the $111,000 to $112,000 zone, which bitcoin has repeatedly tested since last week but has failed to break through. This repeated failure to break higher says that bullish momentum is fading fast, especially as retail buyers are now somewhat hesitant to buy at this zone.
Related Reading: Crypto Market Today: 5 Bullish Catalysts To Watch That Say Bitcoin price Is Going Higher
According to the chart analysis, the current price movement is beginning to resemble a classic double top structure, which is a technical formation that often signals a shift from bullish control to bearish dominance. Given the weakening follow-through on each upward attempt, this setup could be the early signal of a more significant market reversal in the days ahead.
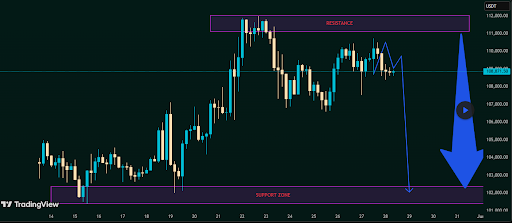
With this in mind, the analyst illustrated this outlook with a projected zigzag path on a 4-hour candlestick timeframe chart, anticipating that another rejection from the resistance band could trigger a cascading MOVE downward. Furthermore, these multiple rejections have led to a simultaneous weakening of support around $105,000, and this level could give way at any time soon.
Bitcoin Might Drop To $102,000 Support Zone
If this projected zigzag path plays out, Bitcoin’s price could break lower in the coming days and head toward a support area located between $101,000 and $102,000. This zone comes into focus because it acted as a strong support level between May 14 and May 19. Bitcoin eventually found footing around this level to stage a rebound that ultimately pushed it to the all-time high of $111,900 reached on May 22.
Although the bull market narrative is still dominant in the long term, the current price action has shifted the short-term tone of the market to bearish. This analysis addresses that potential, and Bitcoin could revisit the $101,000 to $102,000 before another leg up.
At the time of writing, Bitcoin is trading at $105,272, down by 2.5% in the past 24 hours. The $106,800 support level has already given way, and the focus is now on holding above $105,000. If Bitcoin fails to hold above $105,000 in the coming trading sessions, it could lead to a cascading downturn towards $101,000 during the weekend.
