XRP Stages Comeback — Bulls Spot Green Shoots in Price Action

After months of sideways grinding, XRP finally flashes signs of life. Traders are betting this isn’t another false dawn.
Key levels to watch: The 200-day moving average just got reclaimed—a classic bull signal. Now, the $0.55 resistance looms as the next litmus test.
Behind the move: Whale accumulation patterns match early 2023’s breakout setup. Meanwhile, the usual crypto influencers are screaming ’moon’—because nothing says credibility like a Lambo emoji.
Reality check: If macroeconomic headwinds hit, even the strongest chart patterns could crumble. But for now? The path of least resistance points up.
XRP Price Faces Resistance
XRP price found support at $2.220 and recently started a recovery wave, unlike Bitcoin and Ethereum. There was a move above the $2.2650 and $2.280 resistance levels,
There was a move above the 50% Fib retracement level of the downward wave from the $2.3540 swing high to the $2.2279 low. Besides, there was a break above a connecting bearish trend line with resistance at $2.2920 on the hourly chart of the XRP/USD pair.
However, the bears were active NEAR the $2.30 level. The price is now trading below $2.320 and the 100-hourly Simple Moving Average. On the upside, the price might face resistance near the $2.3250 level. It is near the 76.4% Fib retracement level of the downward wave from the $2.3540 swing high to the $2.2279 low.
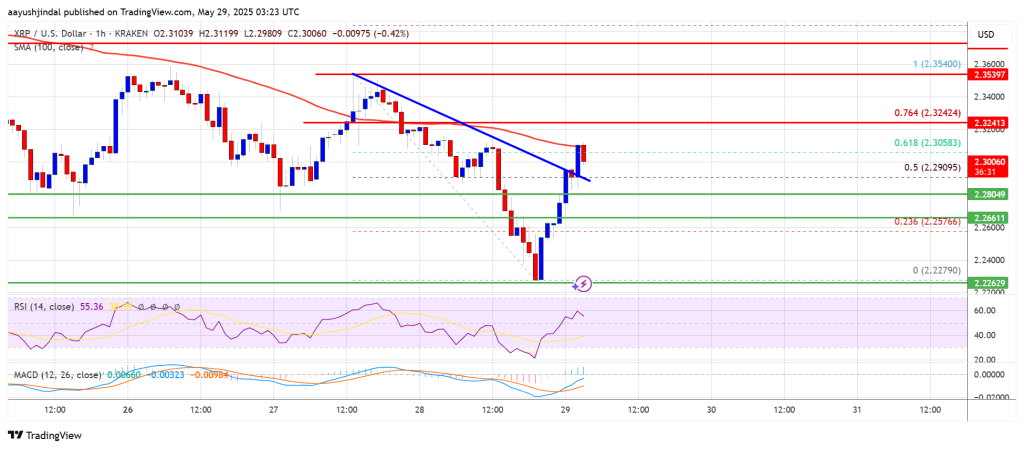
The first major resistance is near the $2.3350 level. The next resistance is $2.350. A clear move above the $2.350 resistance might send the price toward the $2.40 resistance. Any more gains might send the price toward the $2.420 resistance or even $2.450 in the near term. The next major hurdle for the bulls might be $2.50.
Another Drop?
If XRP fails to clear the $2.320 resistance zone, it could start another decline. Initial support on the downside is near the $2.280 level. The next major support is near the $2.260 level.
If there is a downside break and a close below the $2.260 level, the price might continue to decline toward the $2.2320 support. The next major support sits near the $2.20 zone.
Technical Indicators
Hourly MACD – The MACD for XRP/USD is now gaining pace in the bullish zone.
Hourly RSI (Relative Strength Index) – The RSI for XRP/USD is now above the 50 level.
Major Support Levels – $2.280 and $2.260.
Major Resistance Levels – $2.320 and $2.340.

Log in to Reply
Log in to comment your thoughtsComments
Related Articles
|Square
Get the BTCC app to start your crypto journey
Get started today Scan to join our 100M+ users