Dogecoin Teeters on the Brink—Will the Floor Hold or Collapse?

DOGE bulls cling to hope as support levels face another brutal test. The meme coin’s volatility isn’t for the faint-hearted—this isn’t your grandpa’s blue-chip stock.
Technical traders watch key levels like hawks, while ’HODLers’ shrug and buy the dip with leftover pizza money. Meanwhile, Wall Street still pretends not to refresh their DOGE charts during bathroom breaks.
One thing’s certain: in crypto, even the ’joke’ assets move faster than traditional finance’s quarterly reports. Whether this support holds or cracks, the ride won’t be boring.
Dogecoin Price Holds Support
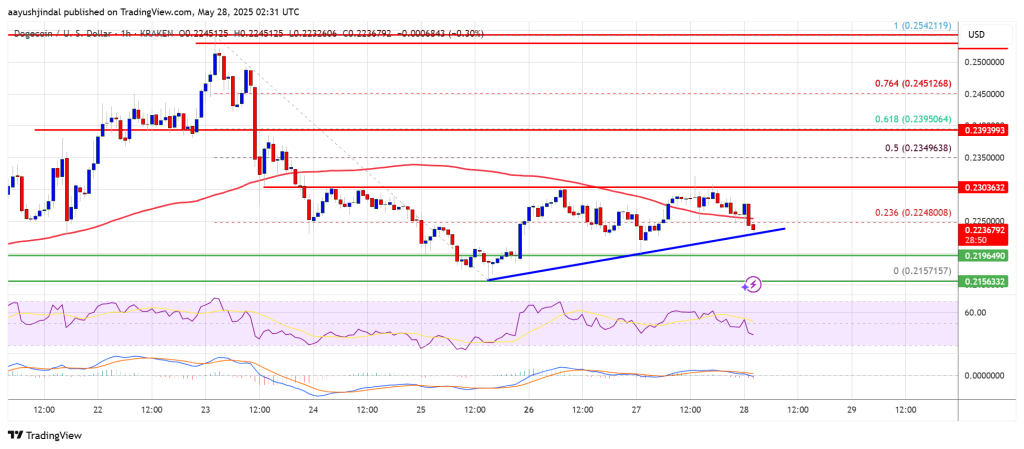
Dogecoin price started a fresh decline after it failed to clear the $0.2550 zone, unlike Bitcoin and Ethereum. DOGE declined below the $0.2420 and $0.2400 levels.
The bears even pushed the price below the $0.2200 level. A low was formed at $0.2157 and the price is now consolidating losses. There was a minor increase above the 23.6% Fib retracement level of the downward MOVE from the $0.2542 swing high to the $0.2157 low.
Dogecoin price is now trading below the $0.2350 level and the 100-hourly simple moving average. There is also a connecting bullish trend line forming with support at $0.2230 on the hourly chart of the DOGE/USD pair.
Immediate resistance on the upside is NEAR the $0.230 level. The first major resistance for the bulls could be near the $0.2350 level. It is close to the 50% Fib retracement level of the downward move from the $0.2542 swing high to the $0.2157 low.
The next major resistance is near the $0.2420 level. A close above the $0.2420 resistance might send the price toward the $0.2550 resistance. Any more gains might send the price toward the $0.2640 level. The next major stop for the bulls might be $0.280.
More Losses In DOGE?
If DOGE’s price fails to climb above the $0.2350 level, it could start another decline. Initial support on the downside is near the $0.220 level and the trend line. The next major support is near the $0.2150 level.
The main support sits at $0.2120. If there is a downside break below the $0.2120 support, the price could decline further. In the stated case, the price might decline toward the $0.20 level or even $0.1840 in the near term.
Technical Indicators
Hourly MACD – The MACD for DOGE/USD is now gaining momentum in the bearish zone.
Hourly RSI (Relative Strength Index) – The RSI for DOGE/USD is now below the 50 level.
Major Support Levels – $0.2200 and $0.2120.
Major Resistance Levels – $0.2420 and $0.2550.
