Bitcoin Holds Steady—Is the Calm Before the Storm?

BTC’s price action tightens like a coiled spring—traders brace for volatility.
Range-bound but restless: The king of crypto tests resistance levels while institutional investors pretend they aren’t watching.
Will the breakout mirror 2021’s bull run, or is Wall Street about to ’discover’ another reason to short it? Only time—and maybe a few shady ETF filings—will tell.
Bitcoin Price Consolidates Gains
Bitcoin price found support NEAR the $107,400 zone and recently started an upside correction. BTC traded above the $108,000 and $108,500 resistance levels.
The price even spiked above the $110,000 resistance zone. However, the bears were active near the $110,750 level. There was a downside correction and the price traded below the $110,000 level. The price dipped below the 50% Fib retracement level of the recent move from the $107,600 swing low to the $110,742 high.
Bitcoin is now trading above $108,000 and the 100 hourly Simple moving average. There is also a connecting bullish trend line forming with support at $108,800 on the hourly chart of the BTC/USD pair.
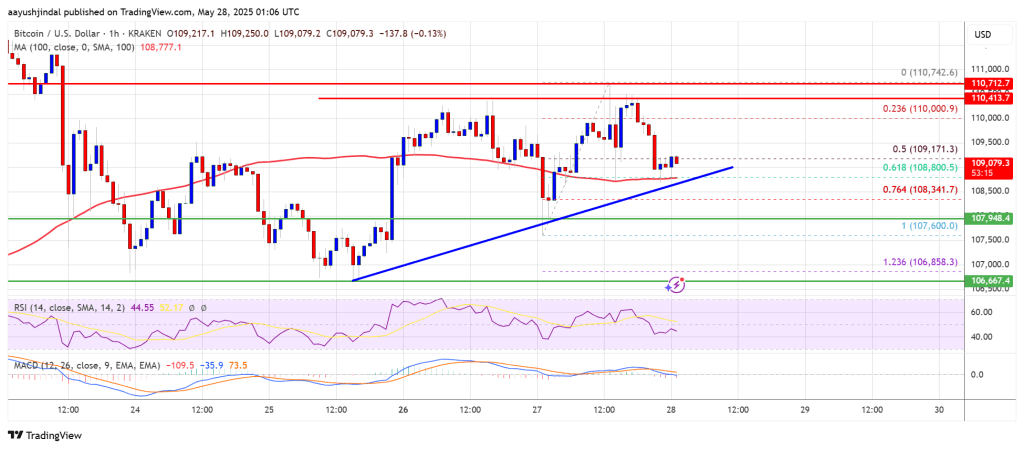
On the upside, immediate resistance is near the $110,000 level. The first key resistance is near the $110,750 level. The next key resistance could be $111,800. A close above the $111,800 resistance might send the price further higher. In the stated case, the price could rise and test the $113,000 resistance level. Any more gains might send the price toward the $115,000 level.
Another Drop In BTC?
If Bitcoin fails to rise above the $110,750 resistance zone, it could start another correction. Immediate support on is near the $108,500 level. The first major support is near the $108,350 level and the 76.4% Fib level of the recent move from the $107,600 swing low to the $110,742 high.
The next support is now near the $107,850 zone. Any more losses might send the price toward the $106,500 support in the near term. The main support sits at $105,000, below which BTC might gain bearish momentum.
Technical indicators:
Hourly MACD – The MACD is now losing pace in the bullish zone.
Hourly RSI (Relative Strength Index) – The RSI for BTC/USD is now below the 50 level.
Major Support Levels – $108,500, followed by $107,500.
Major Resistance Levels – $110,000 and $110,750.
