Bitcoin’s SLRV Ribbons Flash Green—Brace for Impact or Breakout?

Bitcoin’s SLRV ribbons just flipped bullish—a signal that’s historically preceded explosive price action. Here’s what the charts whisper next.
When these ribbons turn green, hodlers perk up. The last three times this happened, BTC ripped 40%+ within months. But past performance is just that—past performance (and your broker’s favorite marketing tool).
This time? Macro headwinds clash with institutional FOMO. Miners are hodling harder than a VC clinging to their token vesting schedule. Liquidity’s creeping back—though not fast enough to satisfy the leverage junkies.
Watch the 200-week moving average like a hawk. Break above? Rally confirmation. Rejection? Another ’buy the dip’ opportunity—or so the perpetually bullish crypto Twitterati will claim.
One truth remains: When Bitcoin’s metrics scream ’go,’ the market usually listens. Eventually. After shaking out the weak hands first, naturally.
Short-Term MA Of Bitcoin SLRV Has Crossed Above The Long-Term
In a new post on X, Capriole Investments founder Charles Edwards has talked about the latest trend in the SLRV Ribbons for Bitcoin. The SLRV Ribbons are based on an on-chain indicator known as the “Short-Term to Long-Term Realized Value (SLRV) Ratio.”
The SLRV Ratio measures the ratio between the bitcoin supply that was moved within the past 24 hours and that dormant since at least six and at most twelve months ago.
The supply younger than 24 hours corresponds to the part of the cryptocurrency that’s becoming actively involved in trading. That is, the part of the supply that’s constantly in motion. Meanwhile, the 6 to 12 months old supply represents the coins that have just matured into the domain of the HODLers.
As such, whenever the SLRV Ratio has a high value, it means the short-term trading interest in the asset is high compared to the appetite for HODLing. On the other hand, it being low can indicate long-term holder behavior is dominant in the sector.
The SLRV Ribbons, the actual indicator of focus here, makes it easier to identify when a shift is occurring from one behavior to the other. It does so by tracking the 30-day and 150-day moving averages (MAs) of the SLRV Ratio.
Now, here is the chart for the indicator shared by Edwards that shows the trend in these MAs over the last few years:
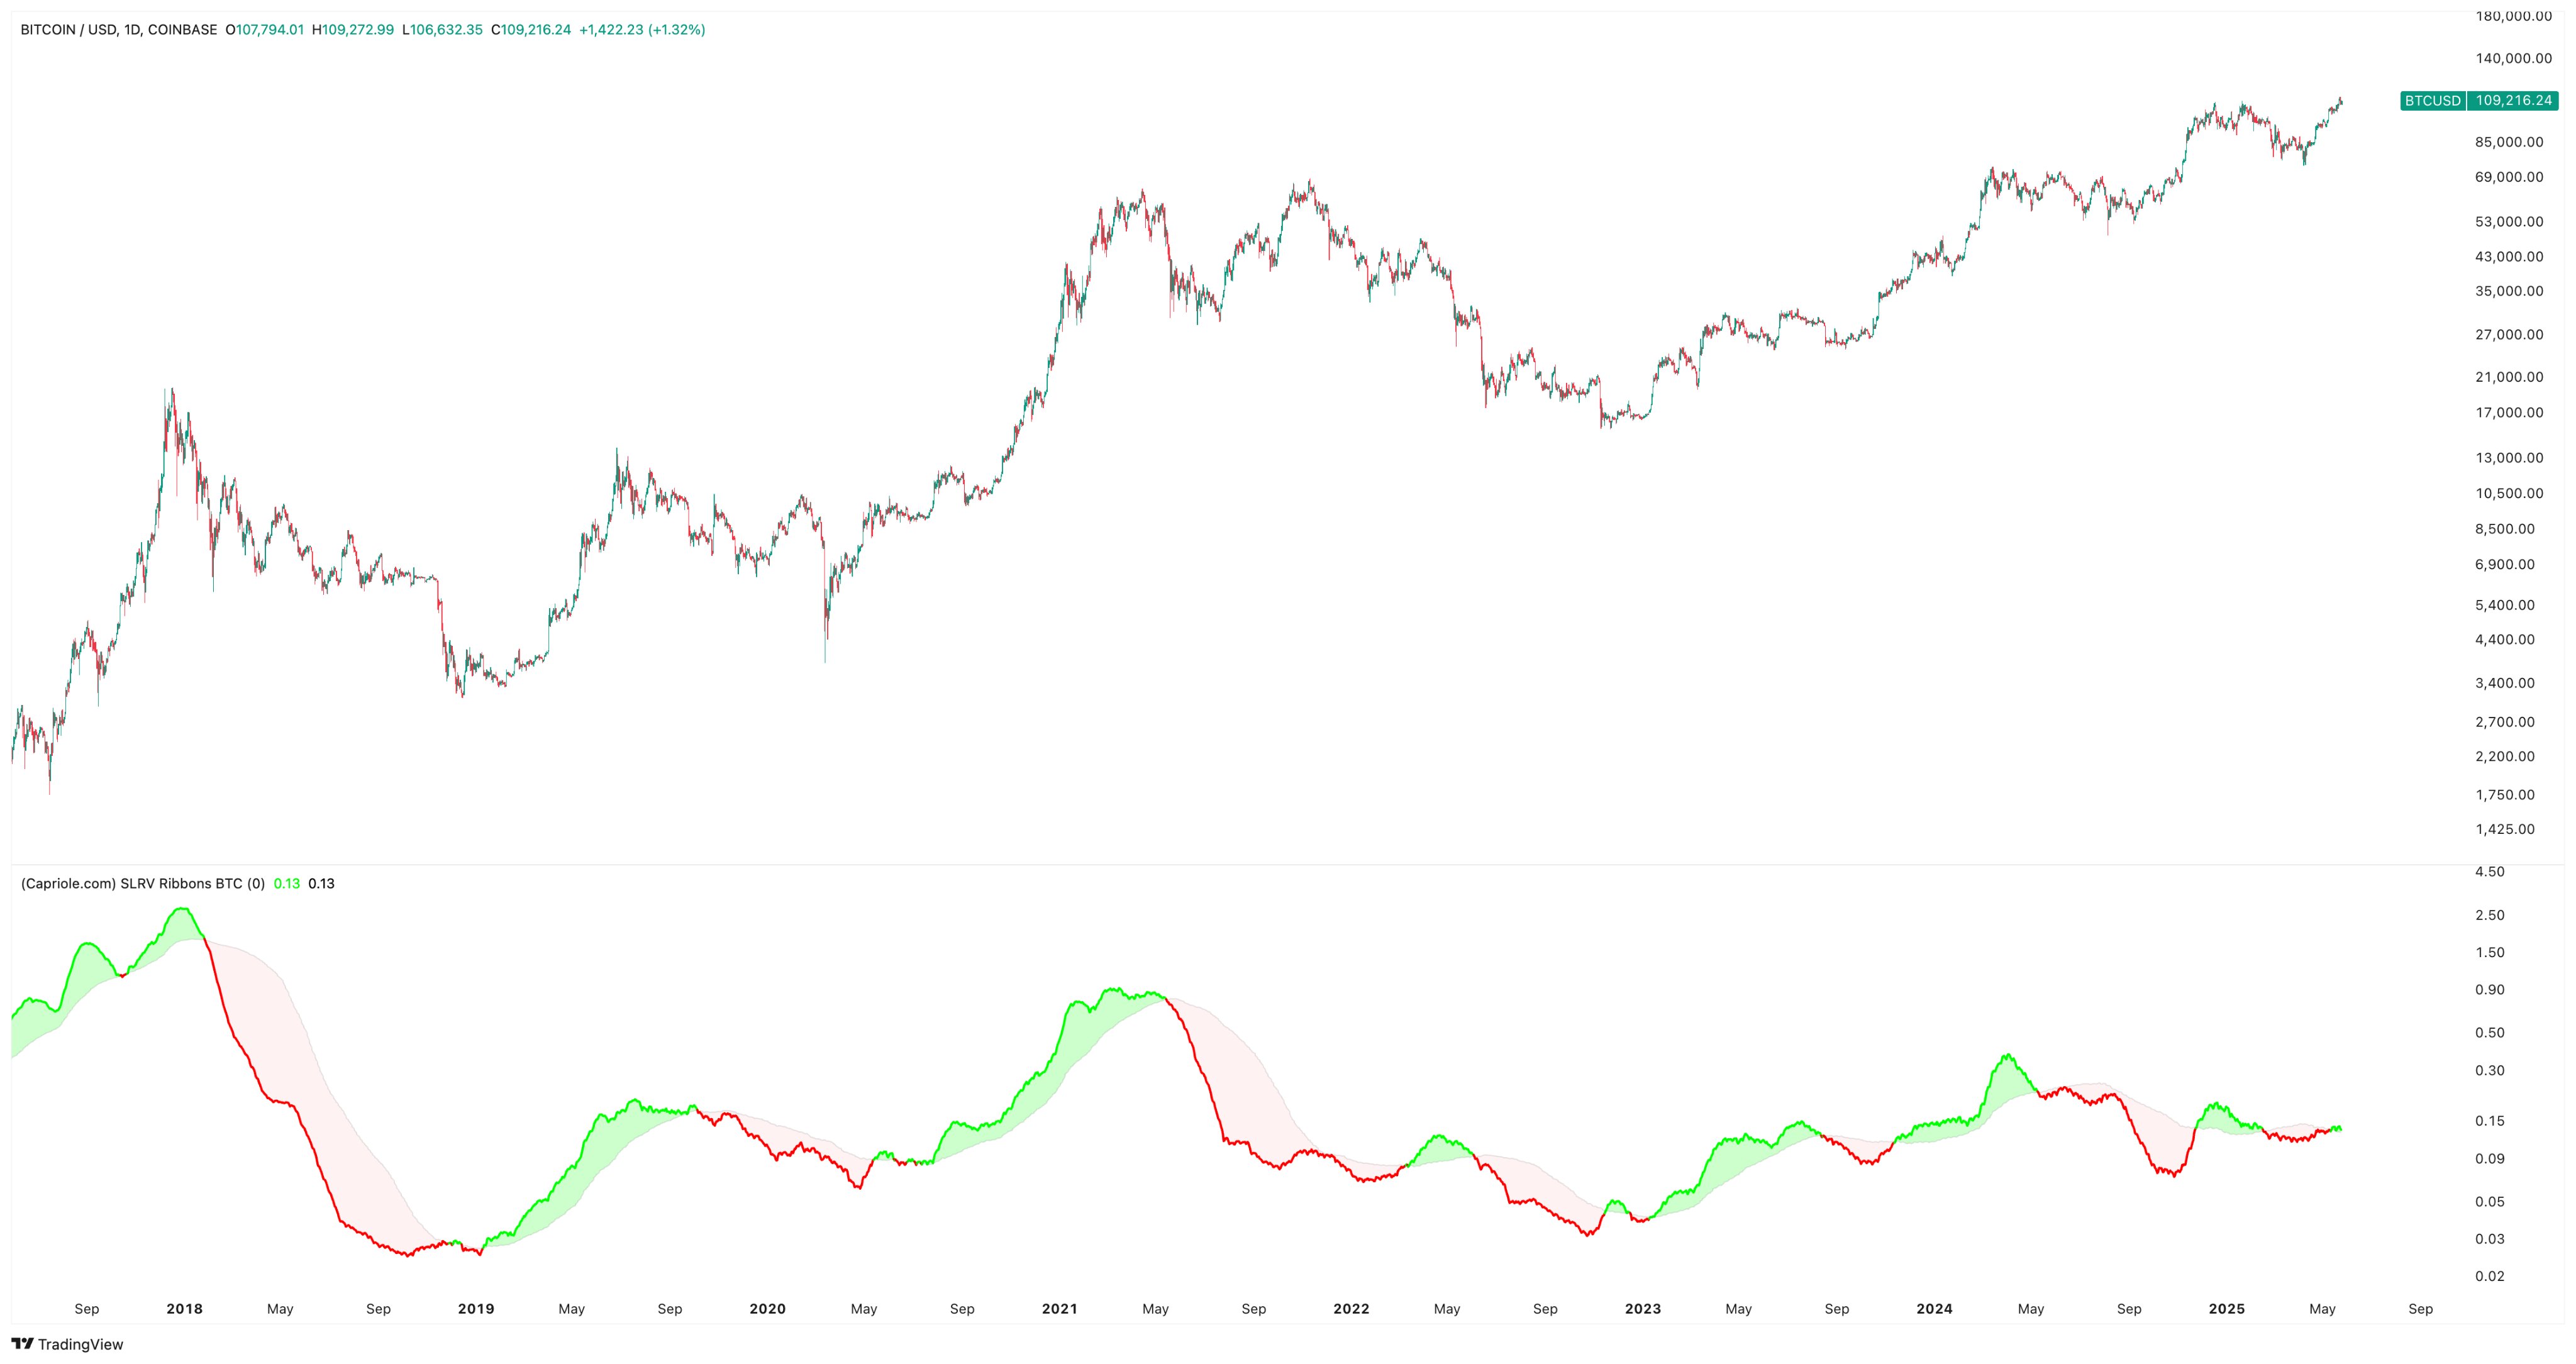
As displayed in the above graph, the 30-day MA of the Bitcoin SLRV Ratio has crossed above the 150-day MA recently. This type of crossover is generally a sign that the market is moving away from HODLing to short-term trading and fresh adoption.
From the chart, it’s apparent that such a crossover (highlighted in green) usually leads into some degree of bullish action for the cryptocurrency’s price. The bull rally from the last couple of months of 2024, for example, followed this signal.
The reverse type of crossover, where the 30-day MA falls under the 150-day one, is likewise a bearish signal. When this cross takes place, it means interest in the asset is waning from new investors, leaving only the most resolute hands to continue quietly accumulating.
With the SLRV Ribbons once again forming a bullish crossover, it now remains to be seen whether the pattern WOULD hold for the asset this time as well.
BTC Price
Bitcoin fell under the $107,000 mark during the weekend, but it would appear the coin has kicked off the new week with recovery as its price is now back at $110,000.
