BNB Stages a Comeback—But Can the Rally Hold?

Binance Coin claws its way back from recent lows as traders bet on a bullish reversal. The crypto—once left for dead by the ’wen lambo’ crowd—now flirts with key resistance levels.
Technical indicators hint at momentum building, but skeptics point to exchange-token fatigue. After all, when was the last time a centralized platform coin didn’t promise ’utility’ before dumping on retail?
All eyes now on whether BNB can smash through overhead supply. One thing’s certain: the market’s memory lasts exactly as long as the last candle.
BNB Price Eyes Steady Gains
After forming a base above the $652 level, BNB price started a fresh increase. There was a move above the $655 and $665 resistance levels, like Ethereum and Bitcoin.
There was a decent MOVE above the 23.6% Fib retracement level of the recent decline from the $691 swing high to the $653 low. Besides, there was a break above a connecting bearish trend line with resistance at $665 on the hourly chart of the BNB/USD pair.
The price is now trading below $675 and the 100-hourly simple moving average. On the upside, the price could face resistance near the $672 level. It is close to the 50% Fib retracement level of the recent decline from the $691 swing high to the $653 low.
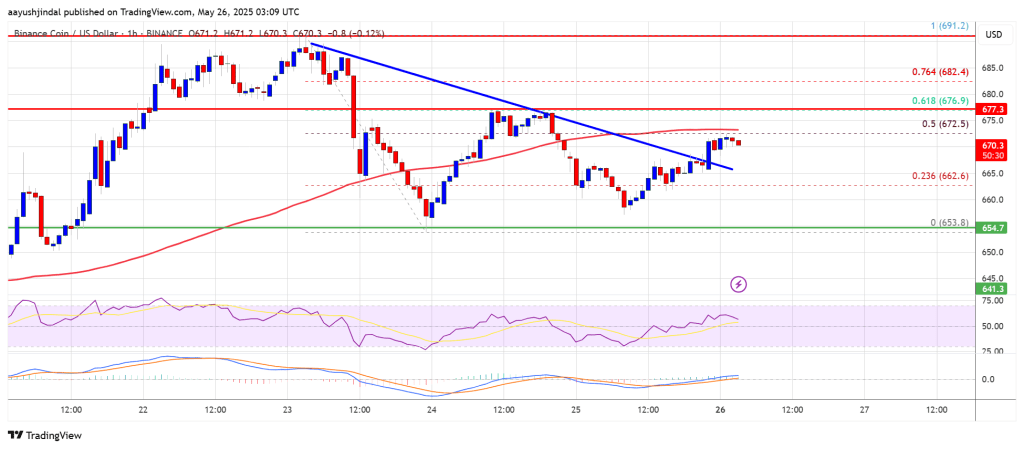
The next resistance sits near the $677 level. A clear move above the $677 zone could send the price higher. In the stated case, BNB price could test $680. A close above the $680 resistance might set the pace for a larger move toward the $685 resistance. Any more gains might call for a test of the $700 level in the near term.
Another Decline?
If BNB fails to clear the $675 resistance, it could start another decline. Initial support on the downside is near the $665 level. The next major support is near the $662 level.
The main support sits at $655. If there is a downside break below the $655 support, the price could drop toward the $650 support. Any more losses could initiate a larger decline toward the $642 level.
Technical Indicators
Hourly MACD – The MACD for BNB/USD is gaining pace in the bullish zone.
Hourly RSI (Relative Strength Index) – The RSI for BNB/USD is currently above the 50 level.
Major Support Levels – $662 and $655.
Major Resistance Levels – $672 and $680.

Log in to Reply
Log in to comment your thoughtsComments
Related Articles
|Square
Get the BTCC app to start your crypto journey
Get started today Scan to join our 100M+ users