Solana Bulls Charge Toward $200 as Buyers Dig In

Solana (SOL) isn’t asking for permission—it’s taking ground. With buyer support hardening like a diamond hands WhatsApp group, the next target flashes bright: $200.
Forget ’hopium’—this rally’s got the kind of momentum that makes over-leveraged degens check their liquidation prices twice. The charts don’t lie: SOL’s eating resistance levels like a memecoin at a Vegas buffet.
Of course, in crypto, what goes up must... well, you know the drill. But for now? The only red in sight belongs to the ’sell’ buttons traders aren’t clicking. (And maybe the faces of those who shorted at $150.)
Solana Price Rises Above $172
Solana price formed a base above the $165 support and started a fresh increase, like Bitcoin and Ethereum. SOL gained pace for a move above the $170 and $172 resistance levels.
The bulls even pushed the price above the $175 level. A high was formed at $177.50 and the price is now consolidating gains above the 23.6% Fib retracement level of the recent wave from the $165 swing low to the $177.50 high.
Solana is now trading above $172 and the 100-hourly simple moving average. There is also a connecting bullish trend line forming with support at $170 on the hourly chart of the SOL/USD pair.
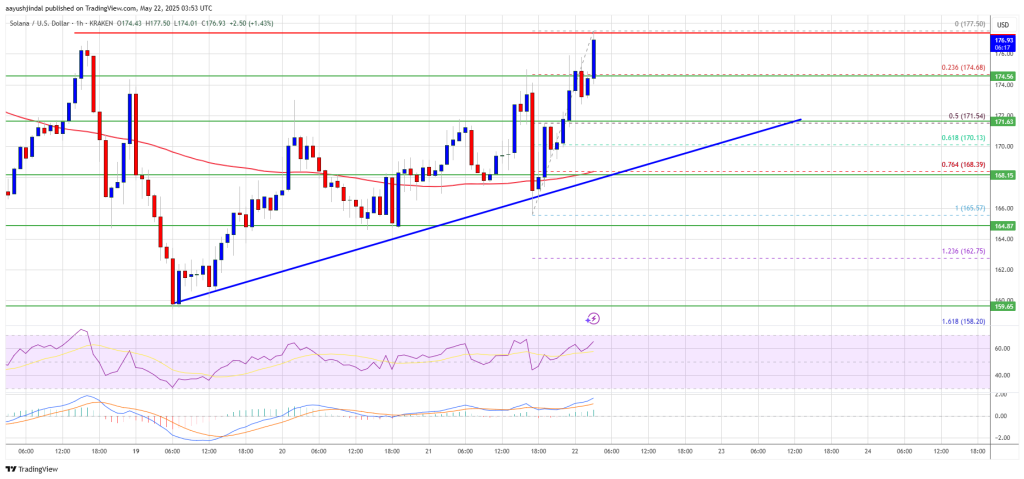
On the upside, the price is facing resistance NEAR the $178 level. The next major resistance is near the $180 level. The main resistance could be $185. A successful close above the $185 resistance zone could set the pace for another steady increase. The next key resistance is $192. Any more gains might send the price toward the $200 level.
Another Decline in SOL?
If SOL fails to rise above the $180 resistance, it could start another decline. Initial support on the downside is near the $174.50 zone. The first major support is near the $172 level or the 50% Fib retracement level of the recent wave from the $165 swing low to the $177.50 high.
A break below the $172 level might send the price toward the $170 zone and the trend line. If there is a close below the $170 support, the price could decline toward the $162 support in the near term.
Technical Indicators
Hourly MACD – The MACD for SOL/USD is gaining pace in the bullish zone.
Hourly Hours RSI (Relative Strength Index) – The RSI for SOL/USD is above the 50 level.
Major Support Levels – $172 and $170.
Major Resistance Levels – $178 and $180.

Log in to Reply
Log in to comment your thoughtsComments
Related Articles
|Square
Get the BTCC app to start your crypto journey
Get started today Scan to join our 100M+ users