Bitcoin Shatters Records—Bull Run Leaves Bears in the Dust

Digital gold just got more expensive—BTC rockets past previous ATH as euphoria grips crypto markets.
Why the surge? Institutional FOMO meets retail traders leveraging up like it’s 2021 again. Meanwhile, Wall Street analysts still can’t decide if it’s a ’speculative bubble’ or ’legitimate asset class’—probably depends on whether their clients are long or short.
Technical indicators scream overbought, but since when did that stop a proper crypto rally? The charts whisper ’parabolic,’ while risk managers quietly update their resumes.
One thing’s certain: the orange coin’s latest breakout proves dead cat bounces don’t typically gain 200%—no matter what the SEC chair’s PowerPoint says.
Bitcoin Price Sets New ATH
Bitcoin price started a fresh increase from the $104,200 support zone. BTC formed a base and was able to clear the $106,000 resistance zone. The bulls pushed the price above $107,500.
The bulls even pumped the price above the $109,000 resistance zone. The price traded to a new all-time high NEAR $110,698 and is currently consolidating gains above the 23.6% Fib retracement level of the upward move from the $104,270 swing low to the $110,698 high.
Bitcoin is now trading above $108,000 and the 100 hourly Simple moving average. There is also a key bullish trend line forming with support at $107,800 on the hourly chart of the BTC/USD pair.
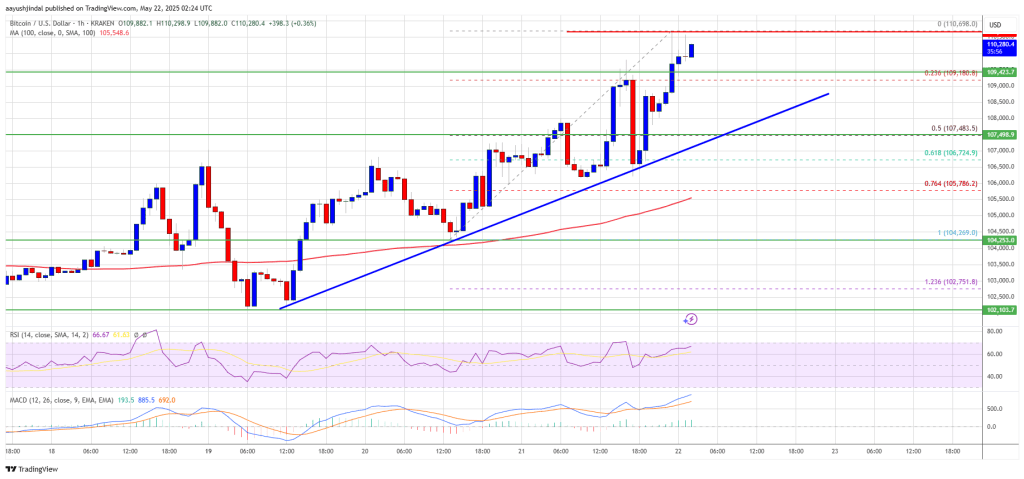
On the upside, immediate resistance is near the $110,850 level. The first key resistance is near the $112,000 level. The next key resistance could be $112,500. A close above the $112,500 resistance might send the price further higher. In the stated case, the price could rise and test the $113,800 resistance level. Any more gains might send the price toward the $115,000 level.
Are Dips Limited In BTC?
If Bitcoin fails to rise above the $112,000 resistance zone, it could start another correction. Immediate support on the downside is near the $109,000 level. The first major support is near the $107,500 level, the trend line, and the 50% Fib retracement level of the upward move from the $104,270 swing low to the $110,698 high.
The next support is now near the $106,500 zone. Any more losses might send the price toward the $105,000 support in the near term. The main support sits at $104,200, below which BTC might gain bearish momentum.
Technical indicators:
Hourly MACD – The MACD is now gaining pace in the bullish zone.
Hourly RSI (Relative Strength Index) – The RSI for BTC/USD is now above the 50 level.
Major Support Levels – $109,000, followed by $107,500.
Major Resistance Levels – $110,850 and $112,000.

Log in to Reply
Log in to comment your thoughtsComments
Related Articles
|Square
Get the BTCC app to start your crypto journey
Get started today Scan to join our 100M+ users