Ethereum’s Bullish Signal Sparks Rally Hopes—But Wall Street’s ’Resistance Band’ Looms

Ethereum’s price chart just flashed its most convincing buy signal since the 2024 halving—right as gas fees hit a 6-month low. Traders are piling in, but the $4,200 resistance level stares like a banker at a DeFi conference.
Can ETH 2.0’s staking yields and ETF rumors overpower the institutional sell walls? The blockchain doesn’t lie—but hedge funds might.
Ethereum Price Regains Traction
Ethereum price started a downside correction below the $2,450 level, unlike Bitcoin. ETH traded below the $2,400 and $2,350 support levels. However, the bulls were active NEAR the $2,300 zone.
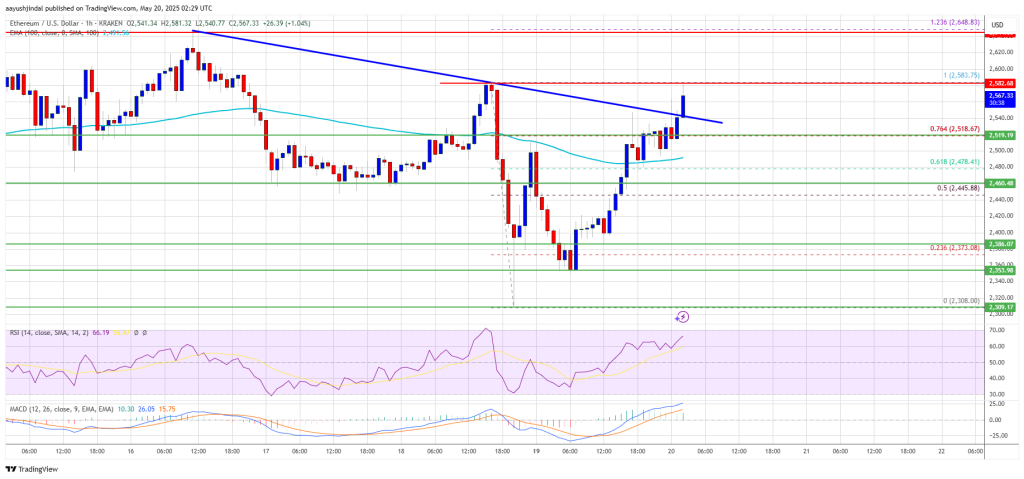
A low was formed at $2,308 and the price started a fresh increase. There was a move above the $2,450 and $2,500 levels. The price surpassed the 61.8% Fib retracement level of the downward move from the $2,583 swing high to the $2,308 low.
Besides, there was a break above a connecting bearish trend line with resistance at $2,530 on the hourly chart of ETH/USD. ethereum price is now trading above $2,540 and the 100-hourly Simple Moving Average. The price is also above the 76.4% Fib retracement level of the downward move from the $2,583 swing high to the $2,308 low.
On the upside, the price could face resistance near the $2,580 level. The next key resistance is near the $2,600 level. The first major resistance is near the $2,650 level. A clear move above the $2,650 resistance might send the price toward the $2,720 resistance.
An upside break above the $2,720 resistance might call for more gains in the coming sessions. In the stated case, Ether could rise toward the $2,780 resistance zone or even $2,840 in the near term.
Another Decline In ETH?
If ethereum fails to clear the $2,650 resistance, it could start a fresh decline. Initial support on the downside is near the $2,520 level. The first major support sits near the $2,450 zone.
A clear move below the $2,450 support might push the price toward the $2,420 support. Any more losses might send the price toward the $2,320 support level in the near term. The next key support sits at $2,250.
Technical Indicators
Hourly MACDThe MACD for ETH/USD is gaining momentum in the bullish zone.
Hourly RSIThe RSI for ETH/USD is now above the 50 zone.
Major Support Level – $2,450
Major Resistance Level – $2,650
