Bitcoin Stalls Below All-Time High as Traders Flock to Equities

BTC’s sideways grind below record levels signals fading bullish momentum—just as the S&P 500 sucks oxygen from the crypto room.
Where’s the dip-buying frenzy?
Retail traders seem preoccupied with chasing AI stocks and ’old economy’ ETFs this cycle. Meanwhile, Bitcoin’s dominance slips despite spot ETF inflows.
Wall Street’s latest bait-and-switch:
After two years of screaming ’digital gold,’ hedge funds now pitch equities as the ’real inflation hedge.’ Classic.
Bitcoin Bulls Eye Breakout But Caution Grows Near Resistance
Bitcoin is just 5% away from its all-time high of around $109,000, trading near $103K as bulls attempt to reclaim momentum. After weeks of strong upward movement and consolidation above key levels, many analysts believe BTC is preparing for a decisive breakout. If price can clear the $105K resistance, it could trigger a new leg into price discovery and signal the start of a powerful bull phase.
However, selling pressure at current levels remains strong. bitcoin has struggled to break higher, and some traders see this consolidation as a sign of potential exhaustion. Daan offered insights on the recent behavior, noting that BTC surged sharply following the tariff-related macro drama, outperforming equities in the process. Yet, as some trade uncertainty faded, stocks kept climbing while BTC stalled near resistance.
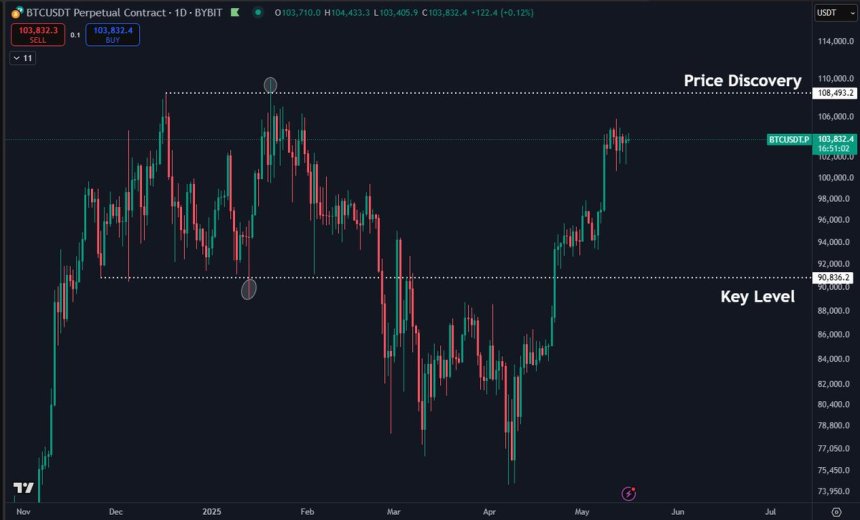
Daan considers $90K his “line in the sand” for long-term spot exposure. If Bitcoin were to drop below that mark, it WOULD suggest a structural breakdown that hasn’t occurred during this cycle. For now, he remains cautiously bullish while BTC stays above that level, but admits the risk-reward was more attractive when BTC was 20–30% cheaper.
He also warns that if equities correct after their aggressive rallies—many stocks have surged 30–50% in a single month—it could drag Bitcoin lower in a short-term flush. With BTC showing relative weakness near resistance, the next MOVE will be critical for confirming either continued upside or the start of a broader pullback.
Tight 4H Range Signals Imminent Price Breakout
The 4-hour chart shows Bitcoin consolidating tightly between $105,700 resistance and $100,700 support, creating a narrow range that suggests a strong move is imminent. Price has been ranging sideways for several days, with multiple failed breakout attempts above $103,600. This level continues to act as a key barrier for bulls.
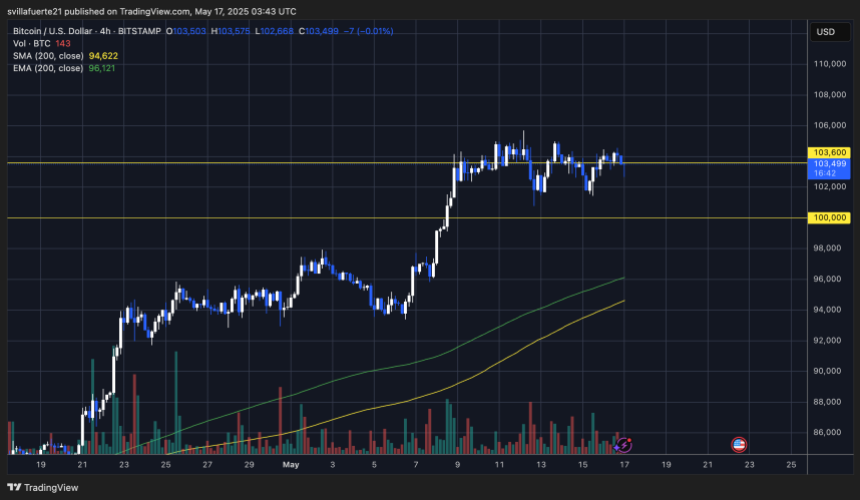
Notably, Bitcoin remains above both the 200 EMA ($96,121) and the 200 SMA ($94,622), reinforcing the medium-term bullish structure. Momentum is neutral in the short term, as shown by the indecisive price action and declining volume. However, the trend remains intact as long as BTC holds above $100,000 — the psychological and technical line in the sand.
If price breaks above $103,600 with volume, it could trigger a move toward the $105,000–$109,000 range and initiate a push into price discovery. On the other hand, failure to hold this support zone could open the door for a quick flush to retest the $98,000–$96,000 area, where the moving averages align.
Traders should watch for a clear breakout or breakdown, especially as moving averages and prior highs converge. This tight setup rarely lasts long, and a decisive move could define Bitcoin’s trend for the rest of the month.
Featured image from Dall-E, chart from TradingView

Log in to Reply
Log in to comment your thoughtsComments
Related Articles
|Square
Get the BTCC app to start your crypto journey
Get started today Scan to join our 100M+ users