Ethereum Teeters on the Brink—$2,350 Looms as Bearish Pattern Solidifies

Ethereum’s chart paints an ugly picture: lower highs, lower lows, and now a target that smells like a 2023 flashback. Bulls are sweating as the $2,350 support level—once unthinkable—now looks like the next stop.
Technical traders are circling. The descending triangle formation (that cruelest of patterns) suggests more pain ahead unless ETH can stage a miracle breakout. Meanwhile, Bitcoin maximalists are—predictably—smugly adjusting their ’I told you so’ tweets.
Remember: Wall Street still treats crypto like a casino. Today’s panic could be tomorrow’s buying opportunity—or just another Tuesday in crypto winter.
Ethereum Lower Lows Present Troubling Trend
Crypto analyst Gianni Pichichero has explained what could be going on with the Ethereum price and why the current trend could be worrying. This goes through the different processes and how the altcoin has been moving since the start of the week, starting from Monday’s bullish rise to the bearish reversal that took the market by surprise.
Gianni explained that the opening range for the week had established the current monthly high before breaking low. This showed an entry of large players into the market as the ethereum price was pushed up rapidly to touch the $2,700 mark for the first time in over a month. This had set a bullish tone for the week, following into the next day as Tuesday also showed recovery strength,
The next day, Tuesday, the Ethereum price did pump once again and placed a higher high than Monday, suggesting that a continuation was in play. The day also closed out in the green as ETH bulls remained dominant through the trading day.
By Wednesday, there had been a turn in the market, whereas the previous days were dominated by bullish rallies, consolidation was the order of the day. This brought the Ethereum price back inside the opening range high of the week and then marked the first red close of the week.
This first red close, Gianni explains, was a bearish signal. It initially didn’t signal that the Ethereum price WOULD continue to crash. However, it did show that the bullishness that began on Monday might finally be over. Then, by Thursday, it was already a full-blown reversal as the market tested the previous day’s lows. Thursday’s red close was just as bearish as the market turned in expectation of bearish news.
Related Reading: Is Bitcoin price Turning Bullish Or Bearish? Crypto Analyst Reveals Critical Levels To Watch
The formation of lower lows on both days has been worrying, and the analyst outlined in the chart that there could be a possible breakdown of the price. In this case, the Ethereum price could again crash back below $2,400, wiping out a notable amount of gains accumulated over the last few weeks.
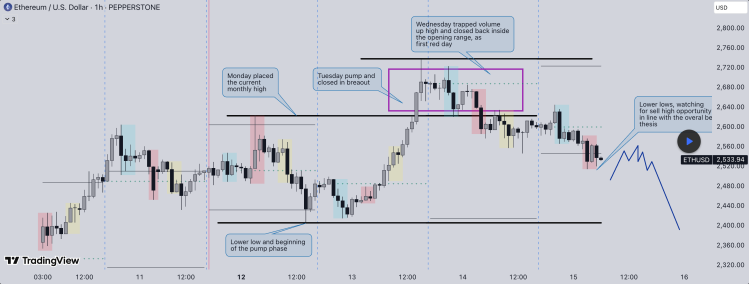
As this unfolds, Gianni suggests that there would not be any crazy moves, but that focus should be on looking for opportunities to sell high in the current market. “ I will be looking for any sell high opportunity after the news, reinforced with bearish price action, as triple tops, double tops and any kind of reversal patterns into the most recent high in place,” he said.
