Bitcoin Bulls Charge: Is the Next Rally Triggering?

BTC’s chart flips green as institutional FOMO creeps back—just as Wall Street ’experts’ finish dumping their bags.
Key levels to watch: The $70k psychological barrier gets its third stress test this month. Breakthrough here could send shorts scrambling.
Meanwhile, crypto Twitter’s ’buy the dip’ chorus reaches deafening levels—because nothing fuels a rally like retail traders front-running BlackRock’s inevitable bids.
Bitcoin Price Aims Higher
Bitcoin price started a fresh increase from the $101,500 support zone. BTC formed a base and was able to clear the $102,500 resistance zone. The bulls even pushed the price above $103,200.
There was a MOVE above the 50% Fib retracement level of the downward move from the $104,980 swing high to the $101,441 low. Besides, there was a break above a connecting bearish trend line with resistance at $103,950 on the hourly chart of the BTC/USD pair.
Bitcoin is now trading above $103,200 and the 100 hourly Simple moving average. On the upside, immediate resistance is NEAR the $104,150 level or the 76.4% Fib retracement level of the downward move from the $104,980 swing high to the $101,441 low.
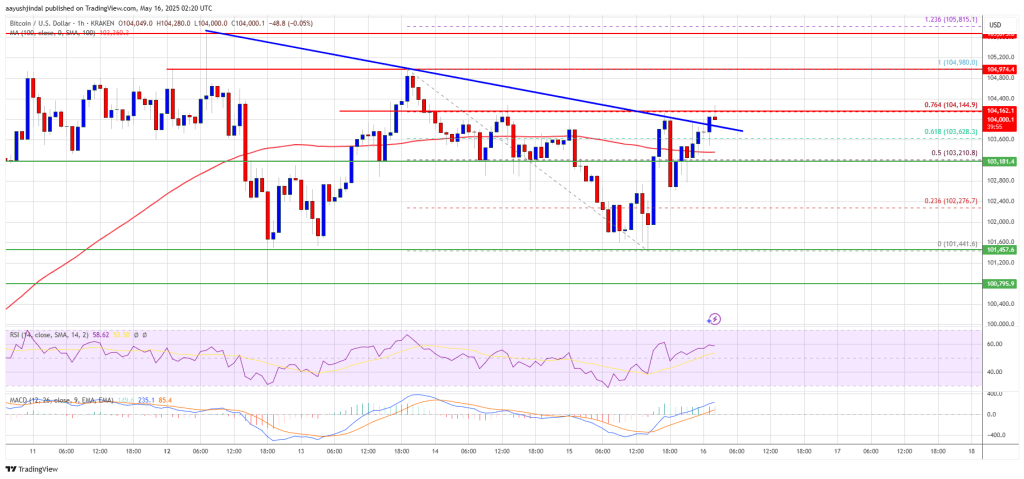
The first key resistance is near the $105,000 level. The next key resistance could be $105,500. A close above the $105,500 resistance might send the price further higher. In the stated case, the price could rise and test the $106,500 resistance level. Any more gains might send the price toward the $108,000 level.
Another Decline In BTC?
If Bitcoin fails to rise above the $104,200 resistance zone, it could start another correction in the short term. Immediate support on the downside is near the $103,200 level and the 100 hourly Simple moving average. The first major support is near the $102,500 level.
The next support is now near the $101,500 zone. Any more losses might send the price toward the $100,000 support in the near term. The main support sits at $98,800, below which BTC might gain bearish momentum.
Technical indicators:
Hourly MACD – The MACD is now gaining pace in the bullish zone.
Hourly RSI (Relative Strength Index) – The RSI for BTC/USD is now above the 50 level.
Major Support Levels – $102,500, followed by $101,500.
Major Resistance Levels – $104,200 and $105,000.
