Ethereum Hits MVRV Wall: $3,100 Emerges as Make-or-Break Resistance Level

Ethereum’s MVRV pricing bands are flashing a clear signal: the $3,100 level isn’t just psychological resistance—it’s a technical battleground. On-chain metrics suggest whales are lurking at this price point, ready to dump or pump depending on which way the wind blows.
Key takeaways:
- MVRV bands act like a profit-taking alarm for traders—current levels show most holders are still in the green (for now).
- The $3,100 zone coincides with 2024’s accumulation peak—where bagholders from the last cycle might finally break even... or panic sell.
Watch for either a decisive breakout or rejection here—because nothing moves crypto markets like a mix of greed, PTSD from previous cycles, and leveraged traders getting liquidated. After all, what’s a key level without a few margin calls to make things interesting?
Ethereum Nears Key Resistance As Altseason Expectations Grow
Ethereum has rallied over 98% since its April 9th low, marking one of its most powerful recoveries in recent years. This explosive MOVE has not only flipped sentiment from bearish to bullish, but also reignited speculation around a broader altseason — a period in which altcoins significantly outperform Bitcoin.
After months of heavy selling pressure that began in late December, Ethereum is now showing sustained strength for the first time. The price has reclaimed critical levels, and momentum continues to build as traders and investors rotate capital back into ETH and other large-cap altcoins. Market participants are watching closely to see if Ethereum can maintain this pace and confirm a longer-term trend reversal.
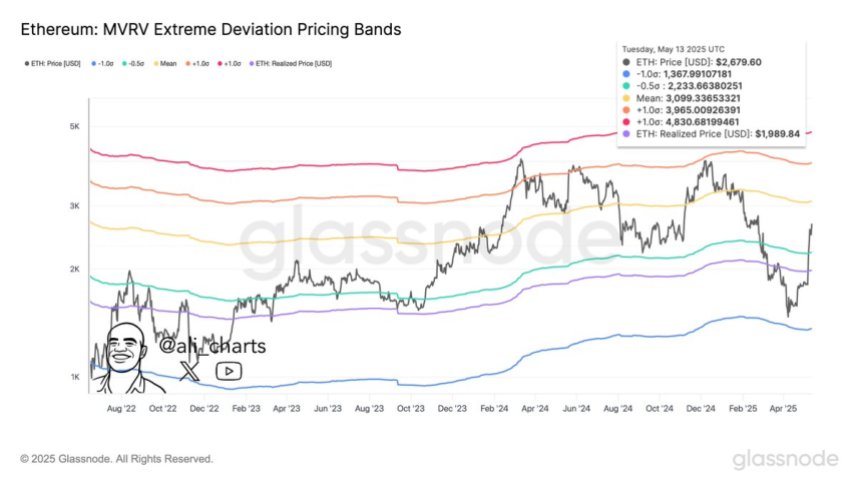
Top analyst Ali Martinez shared Ethereum’s MVRV Extreme Deviation Pricing Bands, offering a clear technical framework for what’s next. According to the data, the next key resistance level is at $3,100 — a region that could act as a short-term ceiling if buying pressure fades. On the downside, the major support zone sits at $2,233, a critical level to hold in the event of a pullback.
As Ethereum continues to climb, these levels will become increasingly important. A clean breakout above $3,100 could open the door to a broader rally across altcoins, while a rejection or correction WOULD likely test the market’s true conviction. For now, ETH remains in a bullish structure, supported by growing volume, on-chain signals, and renewed investor enthusiasm. The coming days will be crucial in determining whether Ethereum leads the charge into a full-fledged altseason.
ETH Price Action: Testing Resistance After Massive Rally
Ethereum (ETH) is currently trading around $2,604, consolidating after a sharp surge that lifted it from under $1,400 to a high of $2,725 in just two weeks. The daily chart shows that ETH is now approaching the 200-day simple moving average (SMA) at $2,702.60, which is acting as a key resistance level. This zone also coincides with recent local highs from early February, making it a critical area to break for further upside continuation.

The recent rally brought strong volume and bullish momentum, with ETH closing multiple daily candles above the 200-day exponential moving average (EMA) at $2,435.66. This is a positive sign for trend reversal after months of sustained bearish pressure. However, today’s pullback signals that bulls are losing some steam as the price tests this crucial resistance.
If ETH can consolidate above the $2,500–$2,600 range and break through the 200-day SMA with convincing volume, the next upside target lies NEAR the $3,100 level, as noted in recent technical studies. On the downside, maintaining support above $2,435–$2,450 is essential to avoid a deeper correction. The coming days will reveal whether Ethereum can turn this consolidation into a true breakout or if further cooling is needed before the next leg up.
Featured image from Dall-E, chart from TradingView

Log in to Reply
Log in to comment your thoughtsComments
Related Articles
|Square
Get the BTCC app to start your crypto journey
Get started today Scan to join our 100M+ users