XRP’s 4-Hour Chart Flexes Muscle—But Short-Term Outlook Still Murky

XRP traders are stuck in purgatory—the token’s short-term trajectory could go either way, but its 4-hour chart paints a bullish picture. Technicals show consolidation near key support levels, with RSI hinting at accumulation. Meanwhile, the ’fundamentals’ crowd is still waiting for that one court ruling to magically make crypto behave like a regulated stock (good luck with that).
Watch for a breakout above $0.55 to confirm momentum. Until then? Grab popcorn—this is crypto, where ’uncertainty’ is the only certainty.
The Bigger Picture For XRP
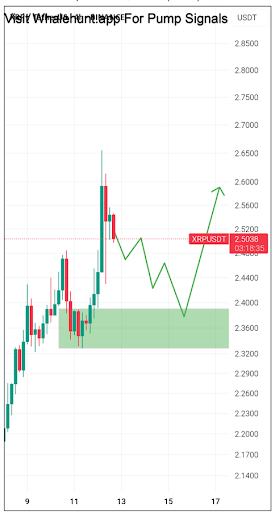
A key insight shared by market analyst Andrew Griffiths suggests that a decisive MOVE toward the bullish order block between 2.3907 and 2.3277, coupled with strong bearish momentum, could indicate the early signs of a structural breakdown.
In his recent post on X, Griffiths emphasized that this price zone has historically acted as a significant area of demand, where buyers typically step in to defend support. However, if sellers dominate this region and the price fails to hold, it could signal a shift in market dynamics, potentially invalidating the current bullish setup.
Despite this technical vulnerability, the overall crypto market sentiment continues to lean bullish. Bitcoin’s dominance remains firm, while the TOTAL2 chart, which reflects the performance of altcoins excluding Bitcoin, maintains a bullish market structure.
These broader trends support the idea that current weakness may be a temporary shakeout rather than the start of a deeper reversal. As such, price action around the order block is key, as it could serve as a turning point in the days ahead.
Trade Setup: Waiting for Confirmation at Key Levels
Andrew Griffiths outlined a strategic trading approach centered around the 4-hour bullish order block between 2.3907 and 2.3277. According to Griffiths, a price test of this zone, if accompanied by weak bearish momentum, could present a favorable buying opportunity.
This aligns with his personal trading methodology, which focuses on identifying high-probability entries where price reacts to key levels with signs of exhaustion from the opposing side. For traders looking to capitalize on potential long setups, this zone may serve as an ideal area for entry, provided certain conditions align. Signs such as decreasing sell volume, long lower wicks (indicating rejection), or bullish candlestick formations within or just above the zone may act as confirmation of weakening bearish pressure.
Griffiths also emphasizes the importance of waiting for a clear reaction, rather than preemptively entering a position, to reduce the risk of a deeper breakdown. A well-placed stop-loss just below the lower boundary of the order block (2.3277) could offer a favorable risk-reward ratio, especially if the broader trend resumes to the upside.

Log in to Reply
Log in to comment your thoughtsComments
Related Articles
|Square
Get the BTCC app to start your crypto journey
Get started today Scan to join our 100M+ users