Bitcoin Whales Splinter on Entry Prices – Big Money Bets on Higher Floors

Whale wallets aren’t just accumulating—they’re rewriting the playbook. While retail traders sweat support levels, crypto’s megaholders show widening divergence in their buy-in targets. Some scooped sub-$50K dips, but the real story? A growing cluster of nine-figure positions built above $65K.
Key takeaway: The smart money isn’t waiting for ’cheap’ Bitcoin anymore.
This isn’t 2021’s reckless FOMO. These are calculated entries by players who move markets—and they’re clearly pricing in institutional demand that hasn’t even hit the tape yet. Meanwhile, Wall Street still can’t decide if BTC is a ’risk asset’ or digital gold (pro tip: it’s been both since 2020).
Last laugh goes to the hodlers: while traditional finance debates definitions, Bitcoin’s whale tier keeps stacking sats like they’re on sale. Which, for anyone who lived through 2022’s carnage, is the ultimate ’told you so.’
Bitcoin Faces Resistance At $104K As Whale Activity Signals Growing FOMO
Bitcoin is currently encountering resistance around the $104,000 mark—a level that may take time to break as it represents a critical barrier before entering price discovery above the all-time high NEAR $109,000. The recent rally has shown remarkable strength, but as BTC consolidates just below its ATH, some selling pressure is expected. A successful breakout could lead to a swift surge beyond $109K; however, failure to do so may result in short-term consolidation or retracement.
Top analyst Axel Adler shared key on-chain insights on X that highlight the evolving psychology of Bitcoin’s largest holders. According to Adler, the absolute difference between the Realized Price of new whales ($91.9K) and old whales ($32.2K) is $59.7K, representing a 185% relative spread to the long-term holder (LTH) basis. This sharp divergence reveals that new “whales” are entering the market at nearly three times the price of early entrants.

In comparison, the same spread in November 2022 was only 62%, indicating more cautious accumulation near the market bottom. The current surge to 185% reflects rising confidence and FOMO, with large buyers willing to accumulate even at elevated prices. For context, during the 2021 cycle peak at $63K, the spread widened to 437%.
This trend suggests that the market is entering a more aggressive accumulation phase, where belief in higher prices is driving demand despite the premium. If bulls manage to absorb the resistance around $104K, it could mark the start of a parabolic move—fueled not just by momentum, but by conviction from both retail and institutional players betting on a new Bitcoin all-time high.
BTC Price Analysis: Key Levels To Watch
Bitcoin is trading around $103,000 after reaching a high of $104,300 earlier today. The 4-hour chart shows BTC facing resistance at the $103,600 level, which aligns with a key supply zone from late December 2024 and early January 2025. This area acted as a previous rejection point during the last major rally and is now being tested again as potential resistance.
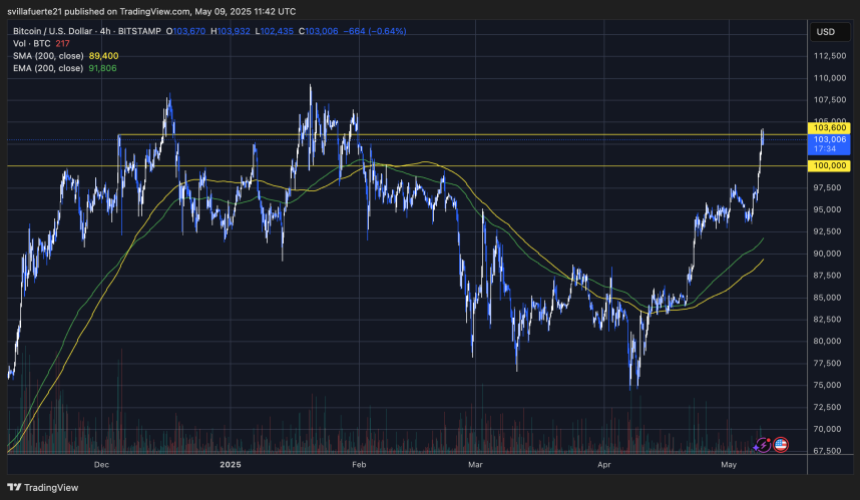
BTC’s recent surge from the $87K–$90K consolidation zone has been aggressive, breaking above both the 200 EMA and 200 SMA (currently at $91,806 and $89,400, respectively) with strong volume. This confirms bullish strength and trend continuation, suggesting that buyers are still in control. However, the current range between $103K and $104K is historically significant, and bulls may need to absorb selling pressure before attempting a MOVE toward the all-time high near $109K.
If BTC consolidates above $100K and holds this level as new support, it would strengthen the case for continued upside. On the flip side, failure to break above $103,600 cleanly could lead to a short-term pullback. Market structure remains bullish overall, but this resistance zone will be critical in determining whether bitcoin enters price discovery or pauses for accumulation.
Featured image from Dall-E, chart from TradingView

Log in to Reply
Log in to comment your thoughtsComments
Related Articles
|Square
Get the BTCC app to start your crypto journey
Get started today Scan to join our 100M+ users