Dogecoin (DOGE) Bullish Signals Flash—Time to Ride the Meme Wave to New Highs?

Dogecoin’s charts are lighting up with bullish indicators—just as Wall Street ’experts’ finish another round of ’crypto is dead’ eulogies.
Technical breakout or meme-fueled frenzy? Either way, DOGE traders are strapping in.
The 2021 rally proved retail traders can move markets faster than hedge funds can short them. Now, with key resistance levels cracking, history might repeat—with or without Elon’s tweets.
Just remember: in crypto, ’fundamentals’ are whatever the crowd says they are today. Enjoy the ride.
Dogecoin Price Aims Higher
Dogecoin price started a fresh increase after it found support near $0.1650, like Bitcoin and Ethereum. DOGE climbed and recovered above the $0.170 resistance zone.
The bulls even pushed the price above the 50% Fib retracement level of the downward move from the $0.1843 swing high to the $0.1642 low. Besides, there is a connecting bullish trend line forming with support at $0.1740 on the hourly chart of the DOGE/USD pair.
Dogecoin price is now trading above the $0.1750 level and the 100-hourly simple moving average. Immediate resistance on the upside is NEAR the $0.1780 level.
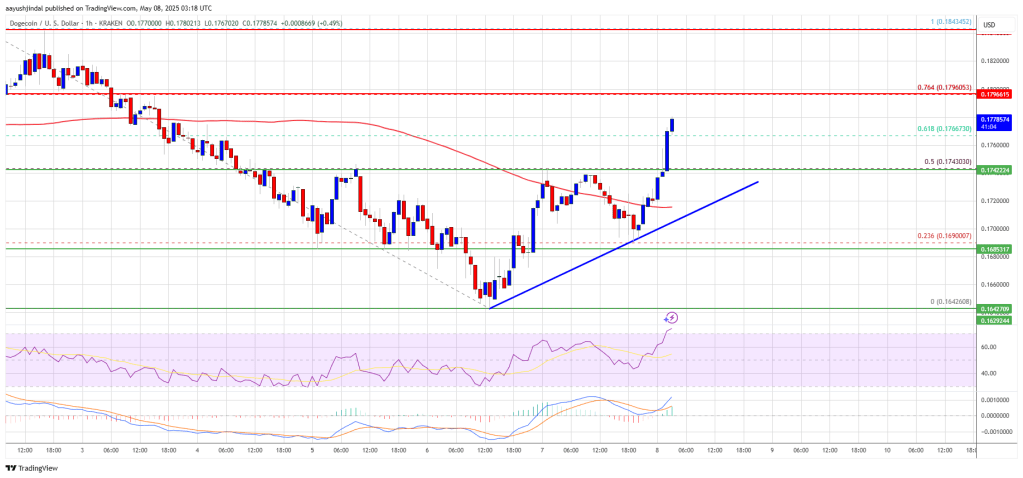
The first major resistance for the bulls could be near the $0.1790 level and the 76.4% Fib retracement level of the downward move from the $0.1843 swing high to the $0.1642 low. The next major resistance is near the $0.1840 level. A close above the $0.1840 resistance might send the price toward the $0.1880 resistance. Any more gains might send the price toward the $0.1920 level. The next major stop for the bulls might be $0.200.
Another Decline In DOGE?
If DOGE’s price fails to climb above the $0.1790 level, it could start another decline. Initial support on the downside is near the $0.1740 level. The next major support is near the $0.1720 level.
The main support sits at $0.1650. If there is a downside break below the $0.1650 support, the price could decline further. In the stated case, the price might decline toward the $0.1550 level or even $0.1450 in the near term.
Technical Indicators
Hourly MACD – The MACD for DOGE/USD is now gaining momentum in the bullish zone.
Hourly RSI (Relative Strength Index) – The RSI for DOGE/USD is now above the 50 level.
Major Support Levels – $0.1740 and $0.1720.
Major Resistance Levels – $0.1790 and $0.1850.
