Bitcoin Flexes 4-Hour Bullish Momentum – Is the Breakout Finally Here?

Bitcoin’s 4-hour chart just printed its most convincing bullish signal in weeks—traders are now eyeing a potential upside explosion.
Key levels to watch: A clean break above $65k could trigger algorithmic buying frenzies, while dip-buyers lurk below $62k like Wall Street sharks circling retail blood.
The real question isn’t if BTC will move, but whether traditional finance will still be pretending they ’don’t understand the tech’ when it does.
Bitcoin Triggers Investor Frustration As $100K Breakout Remains Elusive
Bitcoin is testing investors’ patience once again as it continues to struggle below the key psychological level of $100,000. Despite strong price action in recent weeks, BTC has failed to reclaim this milestone, leaving the market divided over what comes next. While some analysts maintain that the bull run is far from over and expect Bitcoin to break its previous all-time high at $109K, others argue that this current rally is nothing more than a relief bounce within a broader bear market structure.
Following months of heavy selling pressure and macro uncertainty, Bitcoin has shown renewed strength, reclaiming key support levels and climbing back above $97K. This move has reignited bullish hopes, especially as price action forms higher lows and approaches the top of a multi-week range.
Cheds has weighed in with a more optimistic take, highlighting Bitcoin’s “beautiful 4H strength” as the price continues to press against range highs. Cheds noted that BTC is showing more resilience than he initially expected, a sign that bulls still have control, at least for now.
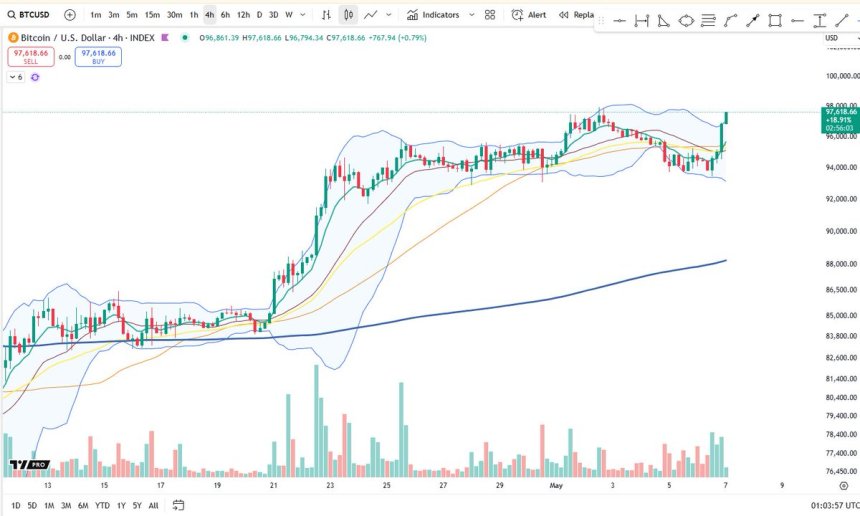
However, the $100K level remains a major resistance zone. A confirmed breakout above it could validate a full-scale continuation of the bull market. Until then, the market remains at a standstill, caught between anticipation and doubt. Traders are watching closely for either a breakout above $100K to trigger new upside momentum, or a breakdown below $92K–$90K to confirm a deeper correction.
In short, Bitcoin’s structure is promising, but indecision dominates. Whether this is a setup for new highs or the calm before renewed downside remains to be seen, the next move could define sentiment for the months ahead.
Technical Details: BTC Testing Critical Supply
Bitcoin is trading at $96,959 after bouncing strongly from support NEAR $94,000 and reclaiming short-term momentum. The 4-hour chart shows a clear attempt by bulls to retest the $98,000 level, a key resistance zone just below the psychological $100K barrier. Price is trending well above both the 200-period simple moving average (SMA) at $88,387 and the 200-period exponential moving average (EMA) at $90,723, reinforcing the bullish structure that has been developing since mid-April.
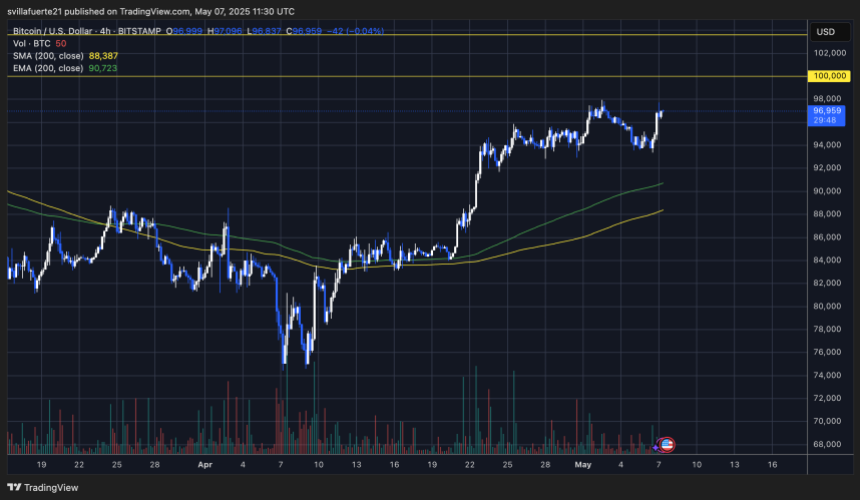
The recent move confirms higher lows and a sustained bullish trend, as BTC continues to build upward pressure against range highs. Volume has picked up slightly during the latest breakout attempt, suggesting fresh demand entering the market. However, the $98K–$100K area has historically triggered selling interest, so a decisive break and close above $100K will be essential to confirm a true breakout.
If bulls manage to reclaim $100K, Bitcoin could quickly extend toward its previous all-time high near $109K. On the downside, holding above the $94K–$95K zone will be critical to preserving bullish momentum. For now, Bitcoin appears to be setting the stage for a breakout, but traders should watch closely as price compresses just under resistance. The next move will likely set the tone for the broader market.
Featured image from Dall-E, chart from TradingView

Log in to Reply
Log in to comment your thoughtsComments
Related Articles
|Square
Get the BTCC app to start your crypto journey
Get started today Scan to join our 100M+ users