Polkadot (DOT) Nears Breakout as Falling Wedge Pattern Signals Bullish Reversal

Polkadot’s DOT token is carving out a textbook falling wedge—a classic bullish reversal pattern that often precedes explosive upside moves. Traders are eyeing the tightening price range as volatility coils like a spring.
When—not if—this wedge breaks upward, the rally could catch sidelined capital flat-footed. Just don’t expect Wall Street analysts to acknowledge it until DOT’s already printed a new ATH (they’ll be too busy downgrading it at the top).
Why The Polkadot Falling Wedge Is Bullish
Crypto analyst Jascrypto recently highlighted that Polkadot has completed a breakout from a multi-month falling wedge pattern. Falling wedges are typically viewed as reversal patterns, and DOT’s successful breakout suggests that downward pressure may be easing after months of consolidation. This structural shift reflects growing Optimism and signals that the asset could be preparing for a larger upward trend.
Jascrypto pointed out that DOT is currently testing the 100-day and 200-day Exponential Moving Averages (EMAs), key technical levels that often act as strong resistance in bearish conditions. He emphasized that a decisive daily close above these EMAs would validate the breakout and signal a shift in market sentiment.
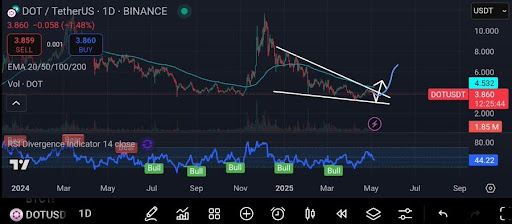
According to Jascrypto, if Polkadot maintains momentum and closes above these critical levels, it may pave the way for a rally toward the $5.5 to $6.0 range in the NEAR term. This move would mark a significant recovery phase for DOT, attracting fresh bullish interest from investors.
In an alternative scenario, Jascrypto noted that the worst-case outcome might see Polkadot dipping as low as $3.120 on higher timeframes. However, he added that such a move could set the stage for a much stronger rebound, propelling the price above the $7 mark once momentum returns.
Momentum Indicators Lean Bullish – Is DOT Ready To Run?
Momentum indicators are beginning to align in favor of the bulls, offering promising signals that Polkadot may be gearing up for a meaningful move higher. The 4-hour Relative Strength Index (RSI) has rebounded from oversold territory, hovering near the midpoint around 50. This shift indicates that bearish momentum is fading, and buyers may be gradually regaining control.
Adding to the optimistic trend, the 4-hour Moving Average Convergence Divergence (MACD) has shown a bullish crossover, where the MACD line crosses above the signal line. A move that often marks the beginning of a new uptrend or a pause in prior downside pressure. Combined, the RSI’s recovery and the MACD’s bullish signal suggest that DOT’s momentum is shifting favorably, setting the stage for a potential breakout continuation if price action remains strong.


Log in to Reply
Log in to comment your thoughtsComments
Related Articles
|Square
Get the BTCC app to start your crypto journey
Get started today Scan to join our 100M+ users