XRP Smashes Into Resistance—Bull Rally or Bull Trap?

XRP’s price action just slammed into a key resistance level—again. The crypto’s been here before, teasing breakout promises only to retreat. This time, the bulls are leaning hard on regulatory clarity wins and Ripple’s slow-mo institutional adoption play.
Technical setup: The $0.55 zone has become XRP’s personal Groundhog Day. Each retest since January 2025 sees heavier volume but weaker follow-through. MACD’s hinting at bearish divergence, while the 200-day MA coils like a spring underneath.
Institutional whispers: Two custody giants quietly added XRP staking last quarter (because nothing says ’long-term bet’ like earning 2% APY on a volatility grenade). Meanwhile, Ripple’s CBDC pipeline keeps expanding—because nothing moves markets like government contracts moving at bureaucratic speed.
Make-or-break: If XRP punches through $0.60 this week, shorts could fuel a run toward $0.75. Fail here? The ’stablecoin’ crowd will start gloating as liquidity bleeds into ETH ETFs. Either way, someone’s about to fund someone else’s yacht.
XRP Price Recovery Could Fade
XRP price started a downside correction below the $2.20 and $2.150 levels, like Bitcoin and Ethereum. The price even declined below the $2.120 level before the bulls appeared.
A low was formed at $2.0780 and the price is now correcting losses. There was a move above the $2.10 and $2.120 levels. The price cleared the 23.6% Fib retracement level of the downward move from the $2.2579 swing high to the $2.078 low.
However, the bears are active near the $2.1650 zone. There is also a key bearish trend line forming with resistance near $2.160 on the hourly chart of the XRP/USD pair.
The price is now trading below $2.170 and the 100-hourly Simple Moving Average. On the upside, the price might face resistance near the $2.160 level. The first major resistance is near the $2.1680 level and the 50% Fib retracement level of the downward move from the $2.2579 swing high to the $2.078 low.
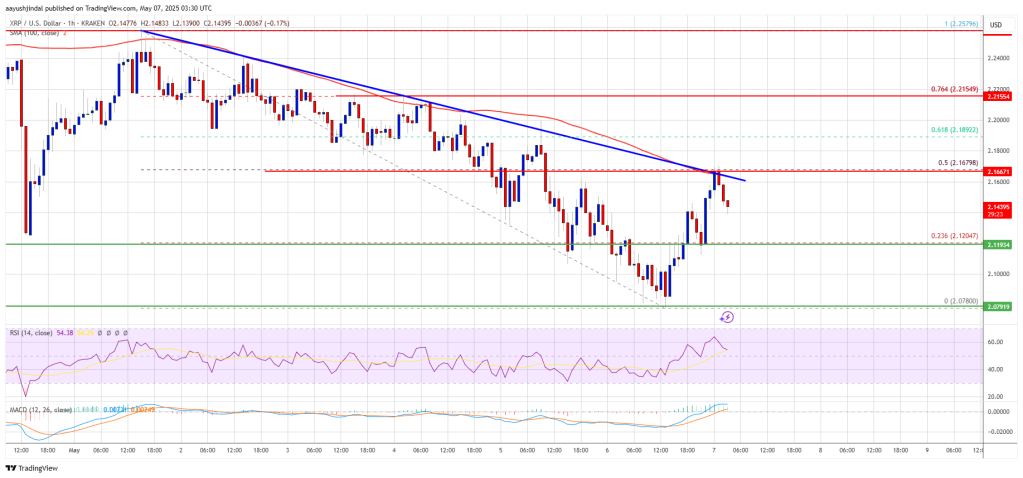
The next resistance is $2.20. A clear move above the $2.20 resistance might send the price toward the $2.220 resistance. Any more gains might send the price toward the $2.250 resistance or even $2.30 in the near term. The next major hurdle for the bulls might be $2.320.
Another Decline?
If XRP fails to clear the $2.160 resistance zone, it could start another decline. Initial support on the downside is near the $2.120 level. The next major support is near the $2.080 level.
If there is a downside break and a close below the $2.080 level, the price might continue to decline toward the $2.050 support. The next major support sits near the $2.020 zone.
Technical Indicators
Hourly MACD – The MACD for XRP/USD is now losing pace in the bullish zone.
Hourly RSI (Relative Strength Index) – The RSI for XRP/USD is now above the 50 level.
Major Support Levels – $2.120 and $2.080.
Major Resistance Levels – $2.1680 and $2.20.
