Ethereum Holds Steady While Whales Gobble Up Supply – Is the Next Rally Loading?

Ethereum’s price action has flatlined, but don’t let the snoozefest fool you—on-chain data shows accumulation patterns straight out of the 2021 playbook. Institutional wallets are quietly stuffing ETH bags while retail stares at memecoins.
Key signals flashing: Exchange reserves dropping like bad tokenomics, staking deposits hitting new highs (because why sell when you can earn yield and pretend it’s not gambling?). Even the gas fees have stabilized—no more $200 monkey JPEG auctions clogging the chain.
The big question? Whether this is the calm before another ’up only’ delusion or just another fakeout for crypto bros to screenshot. TradFi analysts, of course, remain blissfully unaware—too busy downgrading stocks that actually have revenue.
Ethereum Accumulation: ETH/BTC Chart Hints At Imminent Move
Ethereum continues to struggle below the $2,000 mark, failing to reclaim key resistance levels despite broader market activity heating up. While ETH/USD remains directionless and still trades over 55% below its December highs, a closer look at the ETH/BTC chart reveals something more constructive brewing beneath the surface.
Van de Poppe recently shared an analysis highlighting a clear accumulation structure forming in the ETH/BTC pair. After months of consistent downside, the chart shows Ethereum breaking out of a falling wedge and consolidating in a tight range just below critical resistance at 0.0195 BTC. According to Van de Poppe, this is a classic accumulation pattern, signaling that Ethereum may be preparing for a significant breakout relative to Bitcoin.
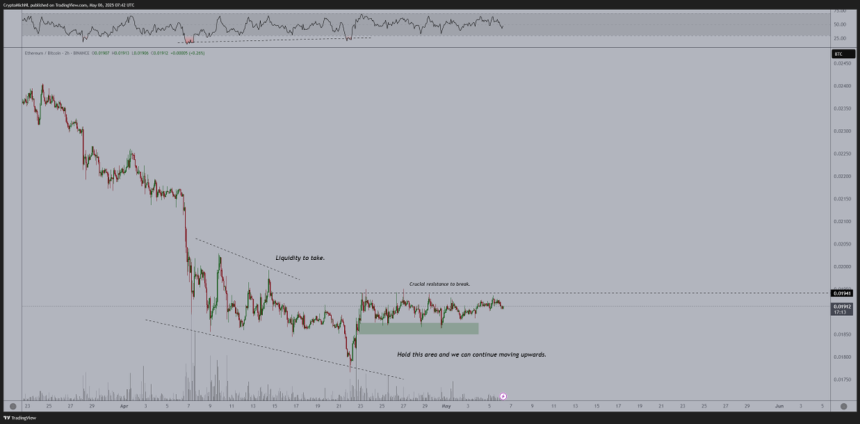
The chart also highlights a key demand zone around 0.0184 BTC—an area ETH has repeatedly held. As long as this level holds, Van de Poppe believes Ethereum could continue to grind higher and eventually take out liquidity above resistance. A successful breakout could mark the start of Ethereum outperforming Bitcoin, a trend often seen during the altcoin expansion phase of a bull market.
However, risks remain. The broader market is still heavily influenced by macroeconomic uncertainty, particularly surrounding U.S.-China tensions. For now, Ethereum’s upside case depends on holding current support and clearing the 0.0195 BTC resistance. If successful, this accumulation may become the base for a strong rally.
ETH Price Consolidates In A Tight Range
Ethereum is currently trading at $1,795.79 after a slight rejection from the $1,874 local high reached on May 1st. The daily chart shows ETH consolidating in a tight range following its rebound from April’s lows NEAR $1,500. However, despite this stabilization, ETH remains well below both the 200-day simple moving average (SMA) at $2,709.54 and the 200-day exponential moving average (EMA) at $2,437.55—indicating that the broader trend is still bearish.

While bulls have managed to prevent further downside, Ethereum has yet to break out of its long-term downtrend. The failure to reclaim $2,000 as support continues to cap bullish momentum, and volume has remained modest during recent price action, showing a lack of conviction from both buyers and sellers.
The structure currently favors accumulation, but ETH must decisively clear the $1,875–$2,000 resistance area to shift sentiment and validate a trend reversal. If it fails to do so, the risk of a renewed pullback toward the $1,650–$1,700 support zone increases.
Overall, Ethereum is at a pivotal stage. The longer it consolidates below major moving averages, the more likely the market remains cautious. A breakout above $2,000 could trigger renewed upside and signal broader market strength.
Featured image from Dall-E, chart from TradingView
