Bitcoin’s Quiet Rally: New Metric Flashes First Bull Signal Since 2024

Forget the Fed—Bitcoin’s plumbing just coughed up a bullish divergence that last appeared before the 2023 rally. On-chain data shows whales accumulating at $62k while retail traders panic-sell.
The ’HODL Wave’ metric—tracking coin dormancy—just snapped its longest bearish streak in history. Translation? Long-term holders refuse to dump at these levels.
Meanwhile, Wall Street’s latest ’crypto innovation’ involves repackaging BTC futures into structured products with 3% yields and 200% fees. Some things never change.
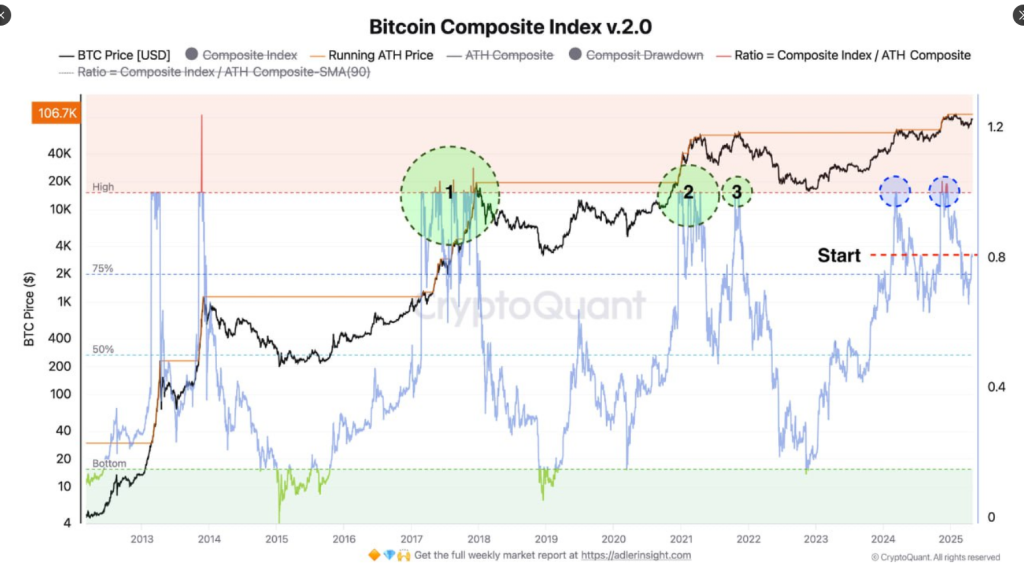
Index Reading Indicates A Potential Early Bull Market
One gauge, which is referred to as the Bitcoin Composite Index v2.0, is now standing at a reading of 0.8. The index mixes price action with blockchain activity and attempts to weigh where Bitcoin could be going. For analyst Constantin Kogan, a reading on this scale has previously appeared ahead of some massive price rallies, such as in 2017 and 2021.
Kogan described how if this number rises to 1.0 and holds, Bitcoin may begin to accelerate significantly faster. The index isn’t quite there now—but it’s heading in the right direction. One of the most important components of the index, the “Running ATH Price,” has begun trending upward too. This suggests that additional buyers are entering the market and faith may be on the rise.
 The upward momentum in Bitcoin is just starting to build, with on-chain metrics like the Bitcoin Composite Index signaling the beginning of a bull market. The index has already reached 0.8 (80%). Here are three possible scenarios:
 Bullish: BTC could surge to… pic.twitter.com/8bZ4vmr2CH
— Constantin Kogan (@constkogan) May 4, 2025
Price Target May Hit $175K If Momentum Continues
If Bitcoin maintains its momentum and drives the Composite Index to more than 1.0, analysts predict the price to rise sharply. The target range given is between $150,000 and $175,000. That’s if bullish momentum accelerates and past trends are repeated.
But if the index remains wedged between 0.8 and 1.0, Bitcoin may stall for a bit. That means a range-bound market, ranging from $90,000 to $110,000. Kogan also highlighted a third, less probable route—if the index falls below 0.75. Then Bitcoin may correct back to $70,000 to $85,000.
Supply Data Shows Where Buyers Stepped InThe second part of the puzzle is from the UTXO Realized Price Distribution chart, also referred to as the URPD chart. Provided by analyst Checkmate, it plots where the holders of Bitcoin last transferred their coins. This provides a sense of who purchased when—and at what price.
A huge segment of buyers appears to have entered between $93,000 and $98,000. That region is currently behaving as a crucial supply zone. It’s the region where investors have just bought Bitcoin and may hold on or sell based on what follows.
Market Awaits Clear Move From Current ZoneBitcoin is squarely in the middle of that range at about $94,000. As Checkmate points out, the next move will depend on whether price breaks out strongly or gets rejected. A strong breakout, evidenced by a powerful daily candle, could turn recent supply into profit and propel prices higher. But if the price can’t rise through this area, it could create a lower high and attract additional selling pressure.
For the moment, Bitcoin sits in wait mode. Traders and analysts are monitoring both the Composite Index and supply figures to determine whether the current lull becomes the next leg up—or a further step down.
Featured image from Gemini Imagen, chart from TradingView
