XRP’s Rally Hits a Wall — Is This Just a Pause or the End of the Bull Run?

XRP’s recent price surge has slammed into resistance, leaving traders wondering if this is a temporary breather or a full-stop reversal. The digital asset—beloved by retail but still eyed skeptically by Wall Street—has failed to break key levels despite bullish crypto market sentiment.
Technical indicators flash mixed signals: RSI hovers near neutral, while volume drips lower. Meanwhile, the ’institutional adoption’ narrative—XRP’s favorite party trick—gets another eye-roll from traditional finance. (Because nothing says ’disruption’ like a token still tied to courtroom drama.)
Next support zone sits 15% down. Bulls need a catalyst—maybe a surprise SEC settlement or an actual use case—to reignite momentum. Until then? Grab popcorn and watch the leverage traders sweat.
XRP Price Dips Again
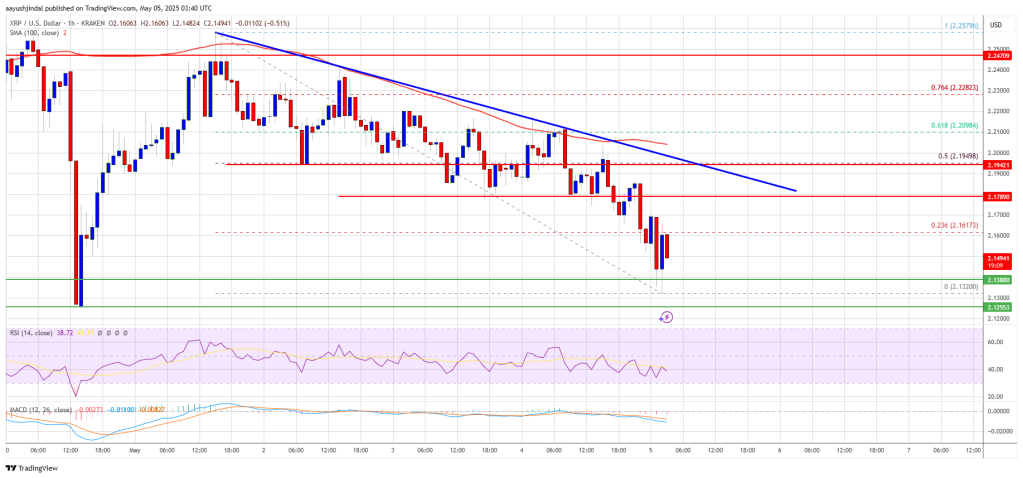
XRP price failed to remain stable above $2.25 and started a downside correction, like Bitcoin and Ethereum. The price declined below the $2.220 and $2.20 support levels.
It even tested the $2.1320 zone. A low was formed at $2.132 and the price is now consolidating losses. It is trading near the 23.6% Fib retracement level of the downward move from the $2.2579 swing high to the $2.1320 low. Besides, there is a new connecting bearish trend line forming with resistance near $2.1950 on the hourly chart of the XRP/USD pair.
The price is now trading below $2.20 and the 100-hourly Simple Moving Average. On the upside, the price might face resistance near the $2.1780 level. The first major resistance is near the $2.20 level and the 50% Fib retracement level of the downward move from the $2.2579 swing high to the $2.1320 low.
The next resistance is $2.220. A clear move above the $2.220 resistance might send the price toward the $2.250 resistance. Any more gains might send the price toward the $2.320 resistance or even $2.350 in the near term. The next major hurdle for the bulls might be $2.50.
More Losses?
If XRP fails to clear the $2.20 resistance zone, it could start another decline. Initial support on the downside is near the $2.1380 level. The next major support is near the $2.1320 level.
If there is a downside break and a close below the $2.1320 level, the price might continue to decline toward the $2.080 support. The next major support sits near the $2.050 zone.
Technical Indicators
Hourly MACD – The MACD for XRP/USD is now gaining pace in the bearish zone.
Hourly RSI (Relative Strength Index) – The RSI for XRP/USD is now below the 50 level.
Major Support Levels – $2.1320 and $2.080.
Major Resistance Levels – $2.20 and $2.250.

Log in to Reply
Log in to comment your thoughtsComments
Related Articles
|Square
Get the BTCC app to start your crypto journey
Get started today Scan to join our 100M+ users