Bitcoin Demand Still Stuck in Negative Territory—When Will Recovery Begin?

Analysts warn Bitcoin’s demand momentum remains deep in the red—a worrying sign for bulls expecting a quick rebound. Despite recent price stabilization, on-chain metrics show weak accumulation patterns reminiscent of bear market bottoms.
Key indicators to watch: Exchange outflows remain sluggish, whale wallets show no aggressive stacking, and derivatives open interest languishes below 2024 highs. "This isn’t capitulation—it’s apathy," quips one trader, noting the eerie calm in BTC markets.
Silver lining? Historically, prolonged negative demand phases precede violent upside reversals. But with Wall Street now treating crypto like a leveraged tech ETF, don’t expect the old playbooks to work. As always in this market, maximalists will call it accumulation while skeptics see dead money—the charts will decide who’s right.
Bitcoin Demand Momentum Continues To Be In Negative Zone
According to a recent CryptoQuant Quicktake post by analyst Crazzyblockk, Bitcoin’s 30-day Demand Momentum is still firmly in negative territory. Currently, the 30-day Demand Momentum stands at around -483,860 BTC, while the 30-day Simple Moving Average (SMA) of the same metric is hovering NEAR -310,700 BTC.
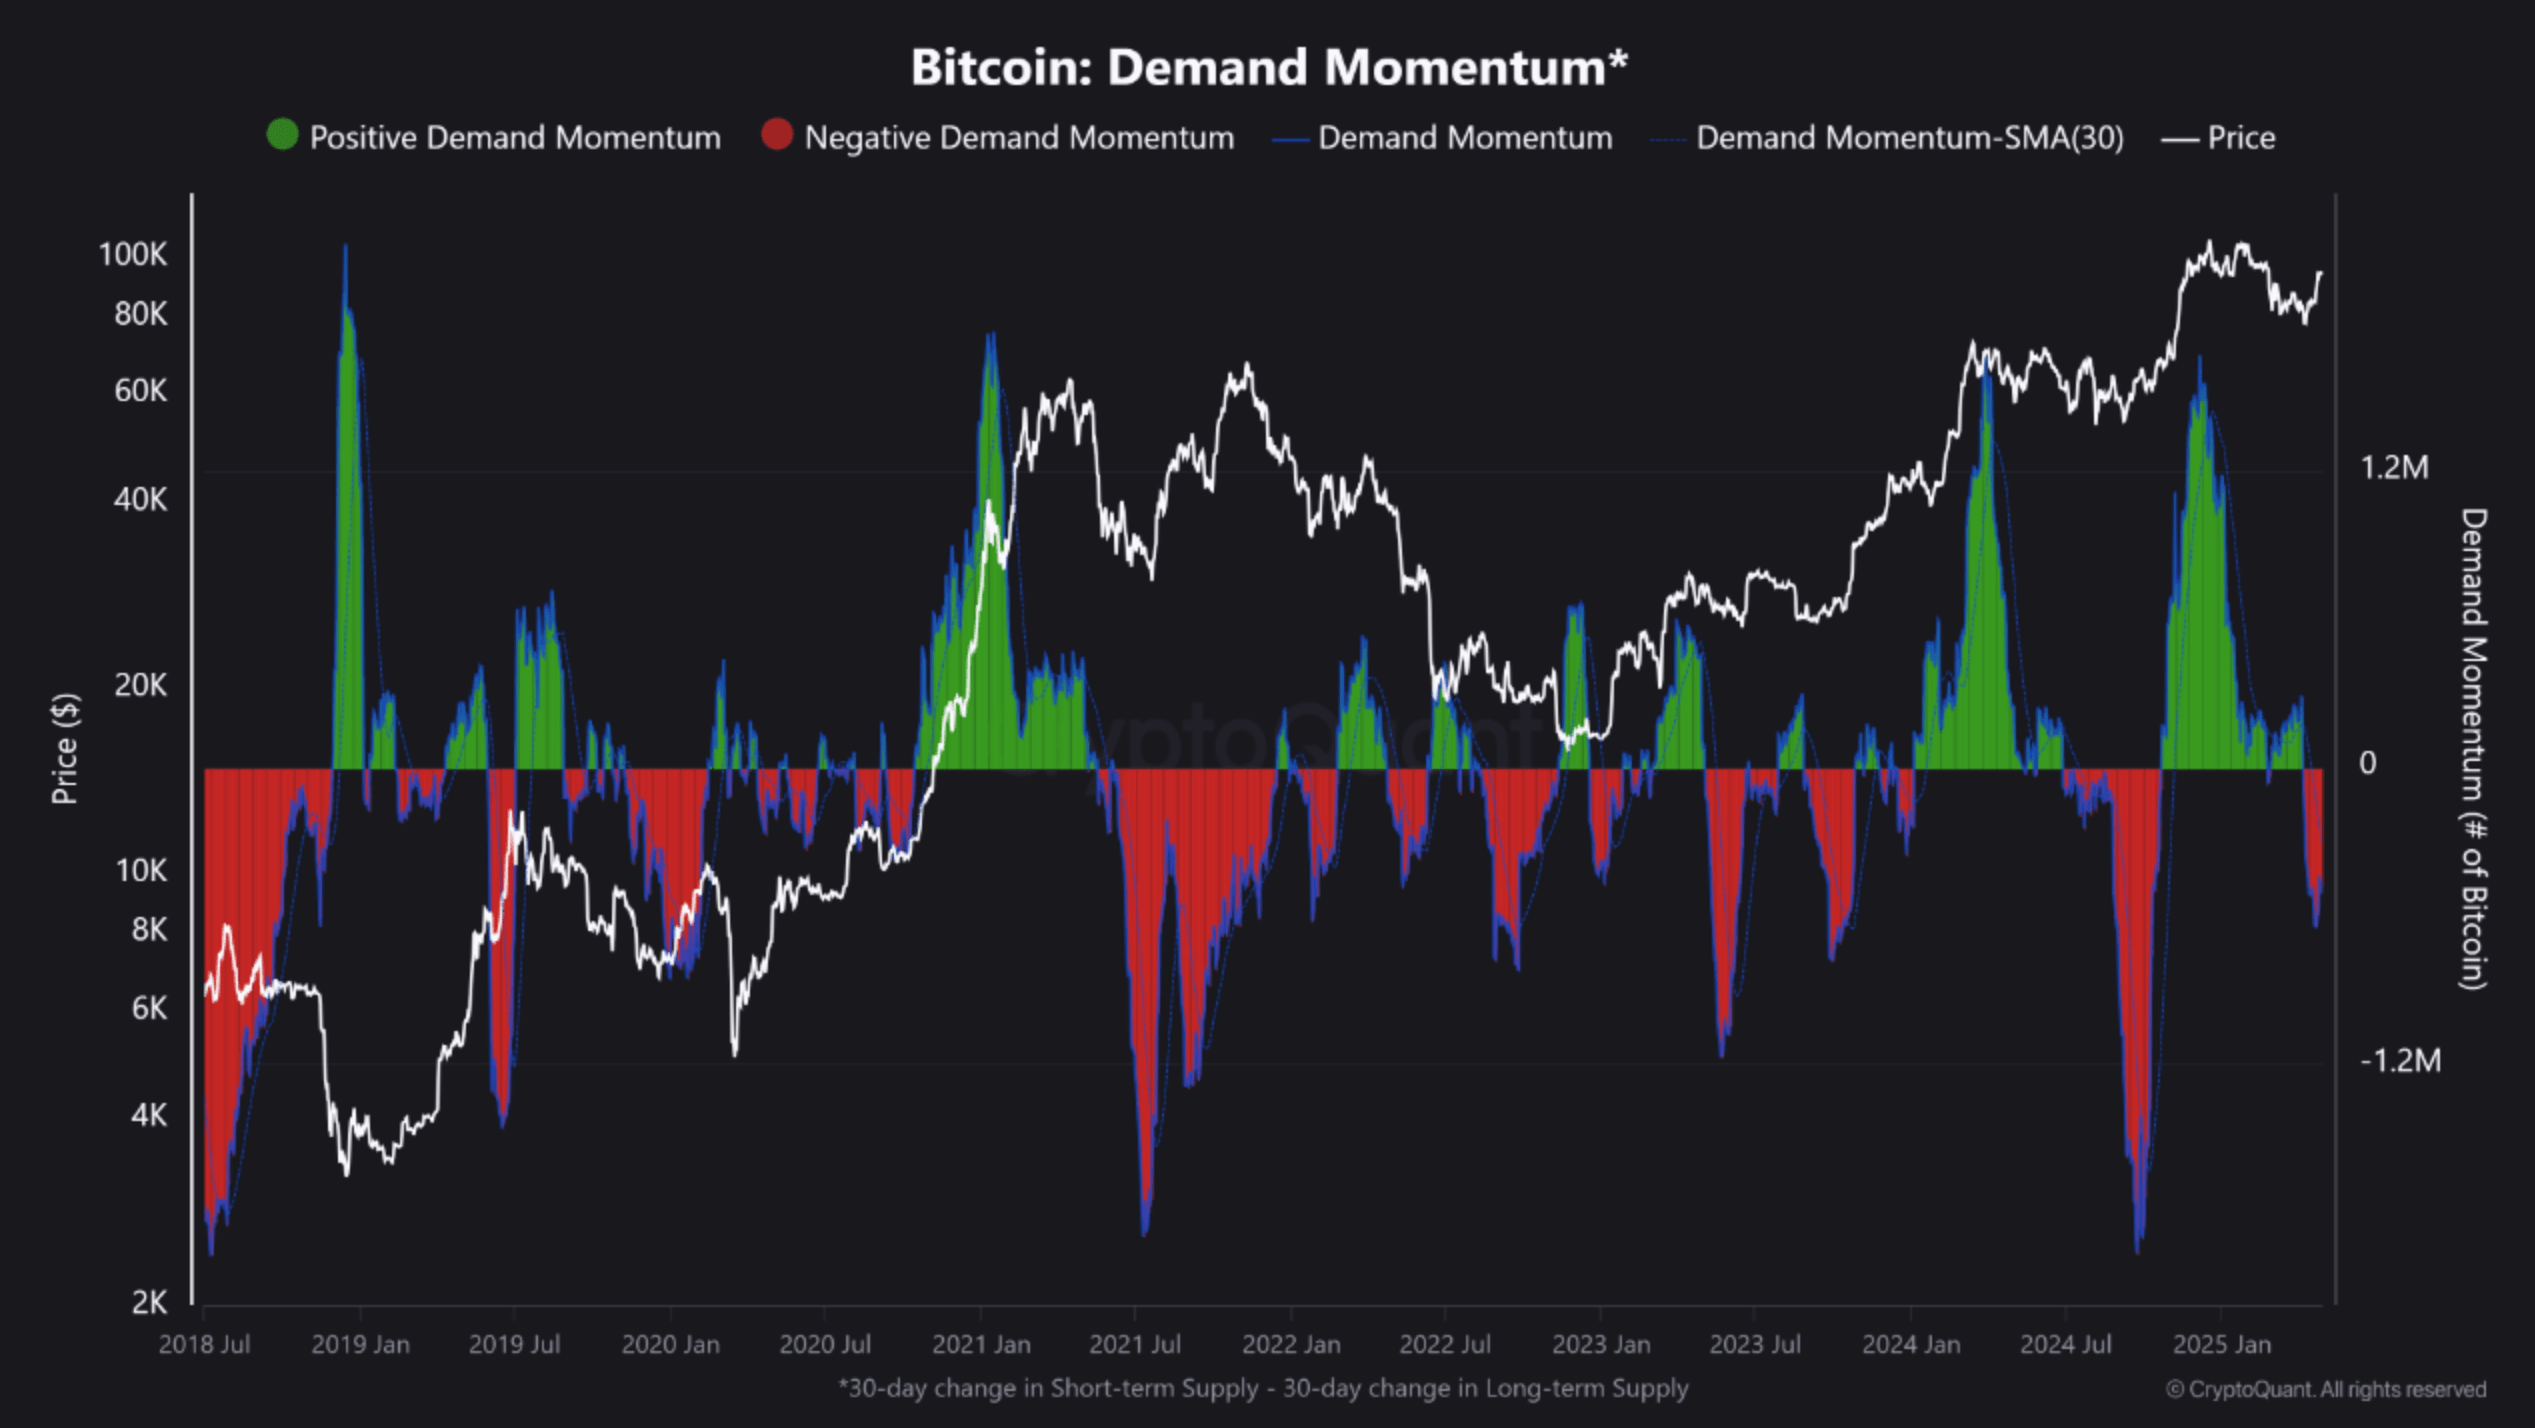
To clarify, the 30-day Demand Momentum is calculated by subtracting the 30-day Long-Term Holder (LTH) Supply from the 30-day Short-Term Holder (STH) Supply. This metric effectively measures the net shift in active demand for BTC.
A rise in short-term holder supply relative to long-term holders implies that market participants are increasingly opting to speculate rather than hold Bitcoin for the long haul.
Trading in the negative zone suggests waning demand from short-term investors. This could be attributed to profit-taking – especially after BTC’s recent 10% rally over the past seven days – or lingering market uncertainty amid global economic concerns, including renewed trade tariff tensions.
Furthermore, the market is experiencing a dynamic where long-term holders are absorbing fewer BTC than what short-term holders are distributing. According to Crazzyblockk, such behavior is commonly observed during late-cycle distribution phases or macro-level consolidation periods.
It is worth noting that Bitcoin has previously experienced similar deep negative divergences in Demand Momentum, specifically during mid-2021 and the second quarter of 2022. In both instances, these divergences were followed by sharp price pullbacks.
On an optimistic note, the ensuing market recovery on both the instances coincided with market bottoms. They also marked the resumption of sustainable bullish momentum in the following months.
If Bitcoin can reverse this negative demand trend and push the metric back into positive territory, it could signal a strong resurgence in investor conviction. A return to the “green zone” would likely mark a renewed uptrend, potentially pushing BTC to a new all-time high (ATH) in the near term.
Positive Signs Emerging For BTC
While Demand Momentum remains weak, other market signals suggest that Bitcoin could be nearing a trend reversal. For example, Bitcoin’s Apparent Demand – a separate on-chain metric – has recently shown a sharp rebound, hinting at a possible return of buying pressure.
Additionally, BTC exchange reserves continue to decline rapidly. According to recent data, Bitcoin just recorded its highest exchange withdrawal volume in two years. This ongoing depletion of exchange-held BTC could lead to a supply squeeze, further supporting bullish price action.
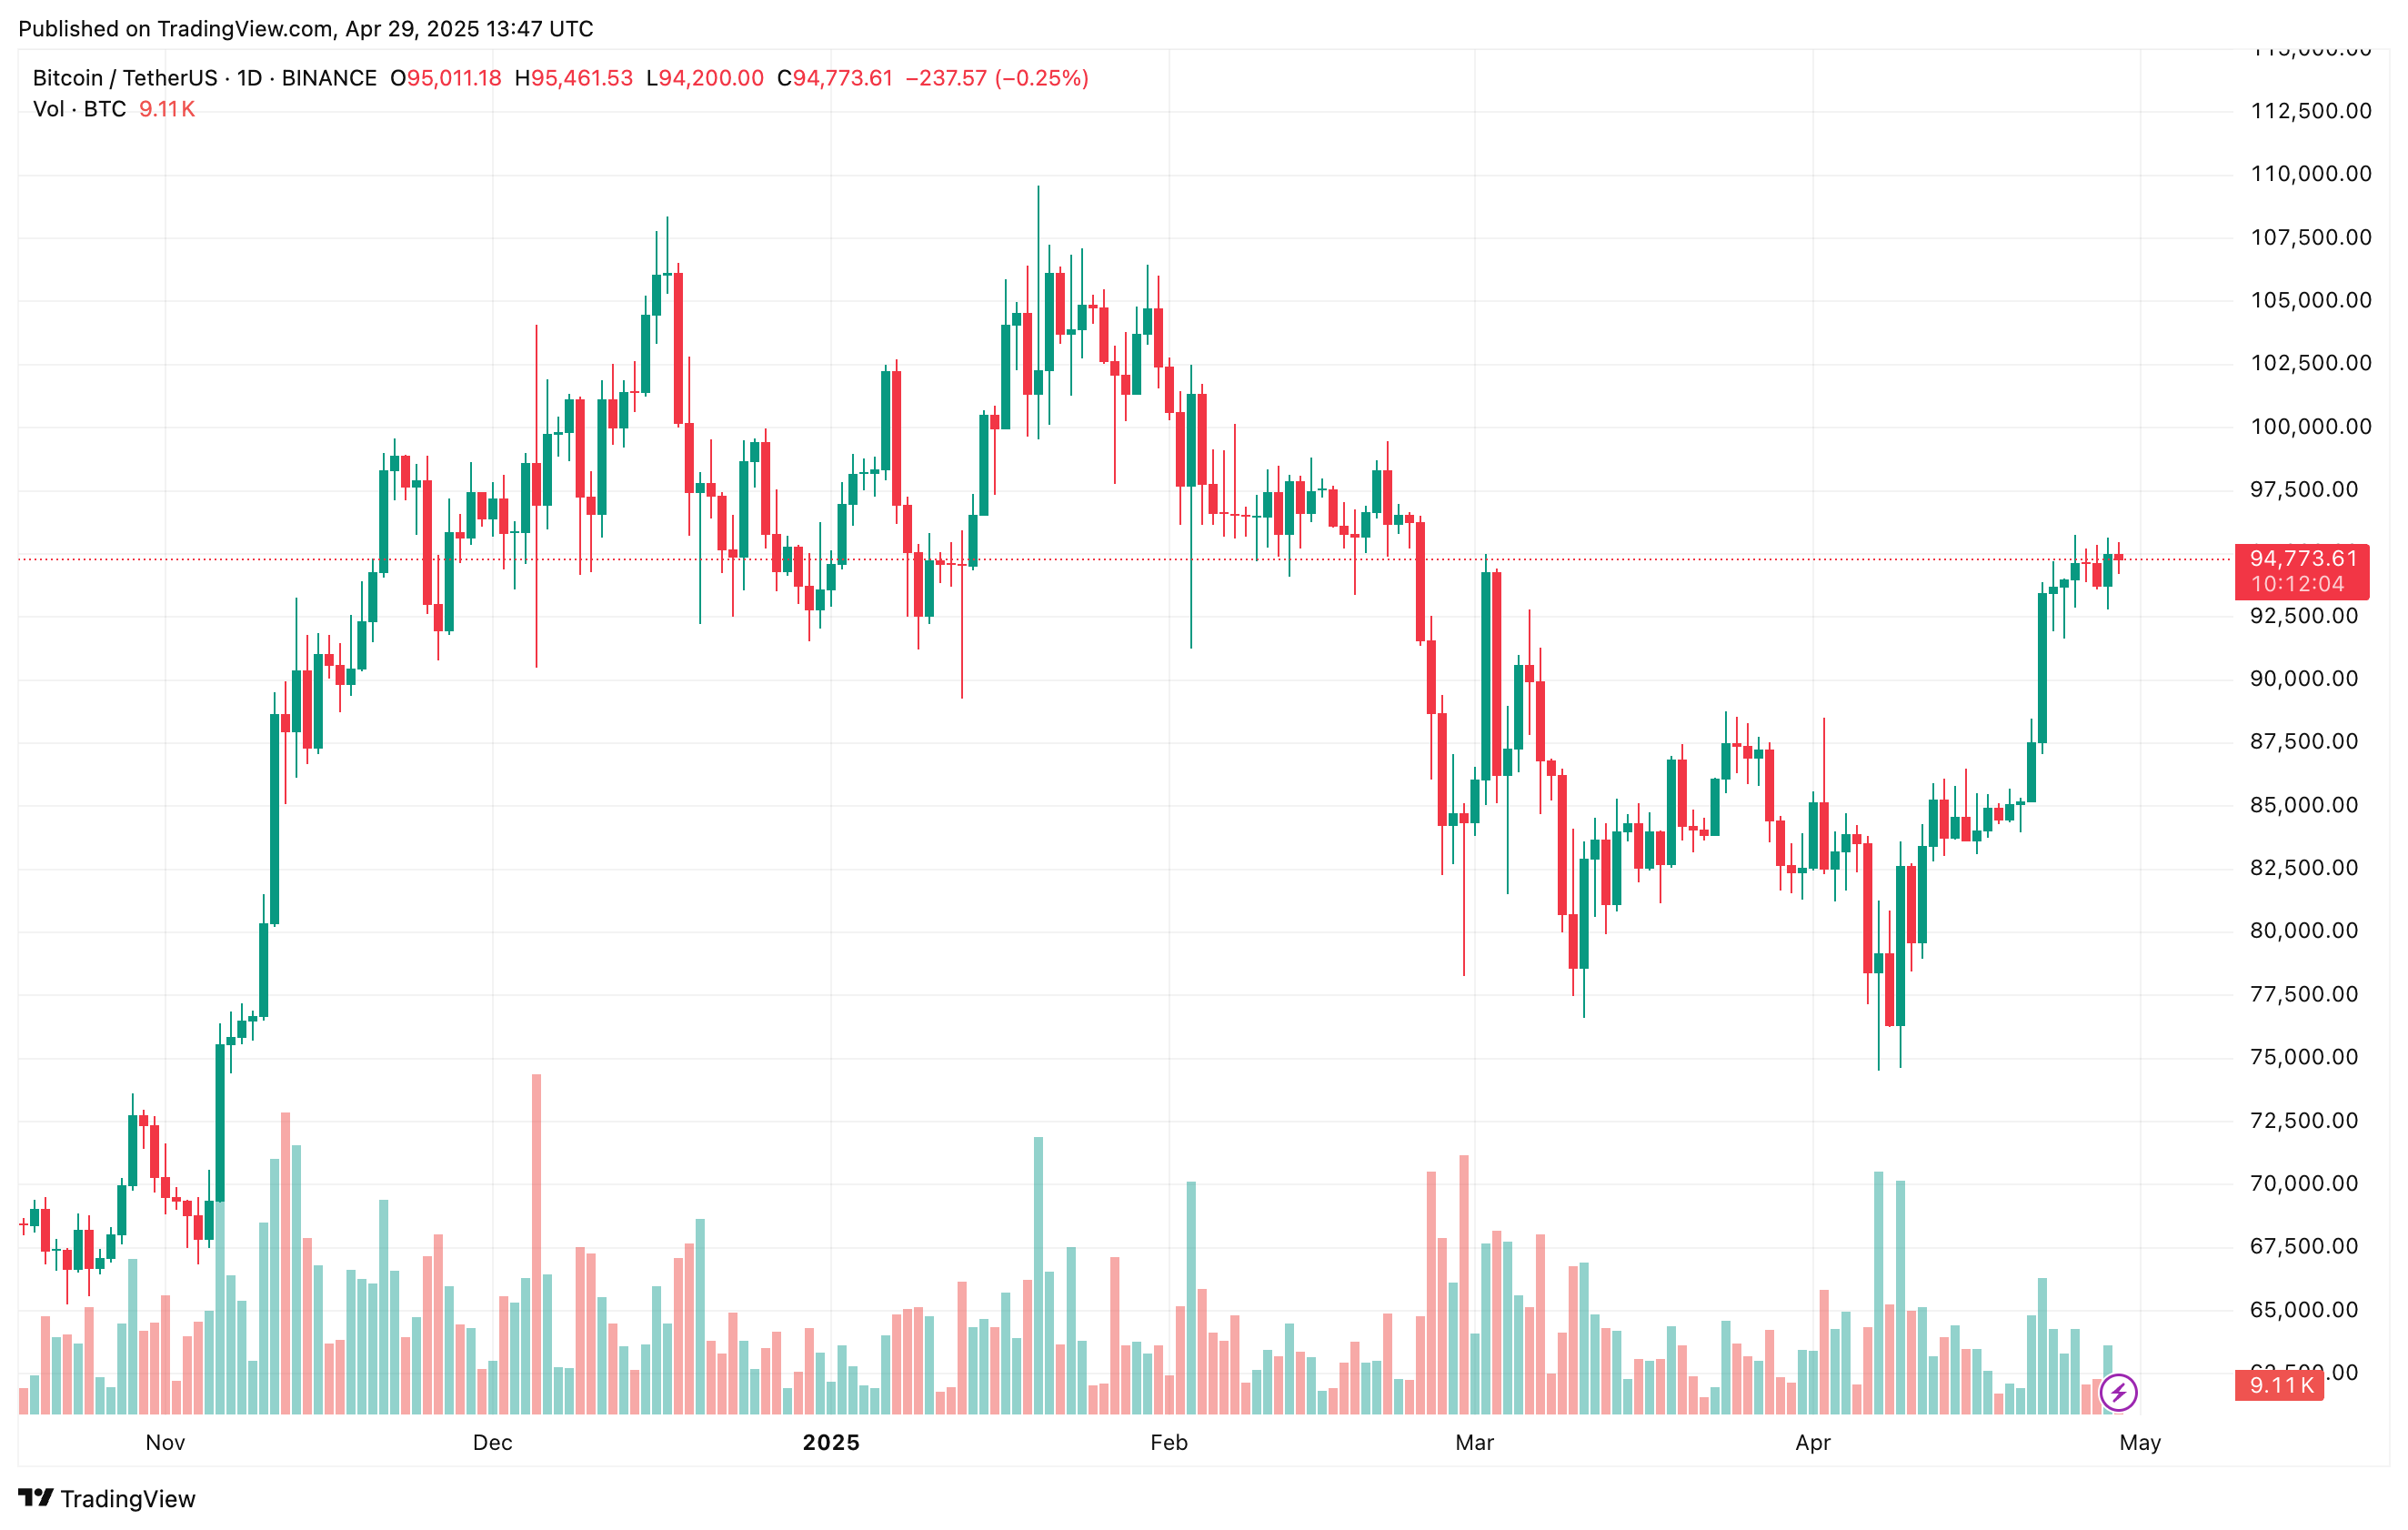
Technical indicators also point toward the possibility of BTC testing its current ATH of $108,786. At press time, Bitcoin is trading at $94,773, up 0.3% over the past 24 hours.