BNB Hovers at Critical Support—Traders Brace for Potential Breakout

Binance Coin (BNB) tightens its coils near a make-or-break support level, with technicals hinting at an imminent rebound. After weeks of sideways action, the charts whisper: accumulation phase complete.
Key levels to watch: A decisive bounce here could ignite a rally toward last year’s ATH, while failure risks a cascade toward institutional ’buy zones’—where hedge funds lurk like vultures over discounted assets.
Funny how ’support’ always seems to crumble right after retail piles in. Just saying.
BNB Price Holds Key Support
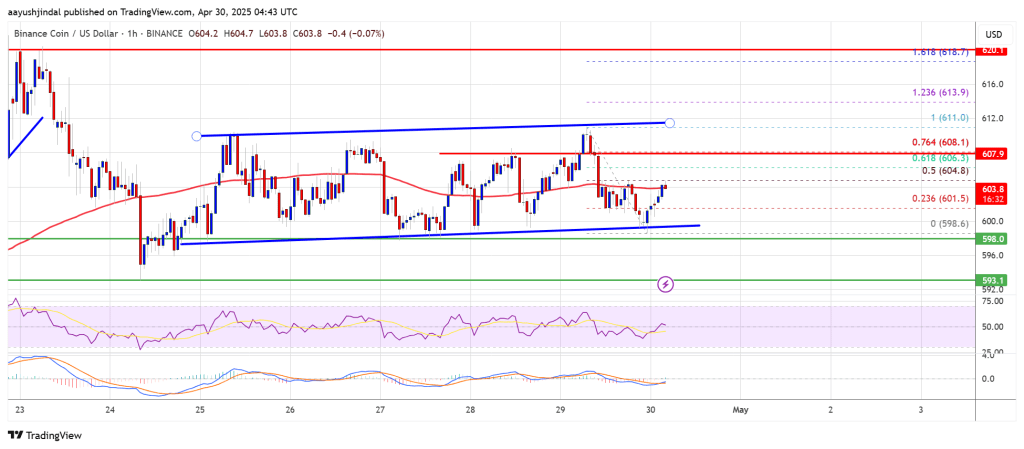
After forming a base above the $592 level, BNB price started a fresh increase. There was a move above the $595 and $600 resistance levels, like Ethereum and Bitcoin.
The bulls even pushed the price above the $605 level. A high was formed at $611 before there was a minor downside correction. The price retested the $600 support zone. A low was formed at $598 and the price climbed above the 23.6% Fib retracement level of the recent decline from the $611 swing high to the $598 low.
The price is now trading near $602 and the 100-hourly simple moving average. There is also a key rising channel forming with support near $600 on the hourly chart of the BNB/USD pair.
On the upside, the price could face resistance near the $606 level and the 61.8% Fib retracement level of the recent decline from the $611 swing high to the $598 low. The next resistance sits near the $610 level. A clear move above the $610 zone could send the price higher.
In the stated case, BNB price could test $620. A close above the $620 resistance might set the pace for a larger move toward the $635 resistance. Any more gains might call for a test of the $650 level in the near term.
Another Decline?
If BNB fails to clear the $610 resistance, it could start another decline. Initial support on the downside is near the $600 level. The next major support is near the $598 level.
The main support sits at $592. If there is a downside break below the $592 support, the price could drop toward the $585 support. Any more losses could initiate a larger decline toward the $580 level.
Technical Indicators
Hourly MACD – The MACD for BNB/USD is gaining pace in the bullish zone.
Hourly RSI (Relative Strength Index) – The RSI for BNB/USD is currently above the 50 level.
Major Support Levels – $600 and $598.
Major Resistance Levels – $606 and $610.
