Bitcoin Holds Firm Above Critical Support — Is the Next Leg Up Imminent?

BTC defies gravity—again—as institutional traders pile in while retail investors check their Robinhood accounts for the first time since 2021.
Key levels hold: The $60K support floor becomes a springboard for bulls eyeing $75K resistance. Meanwhile, Wall Street ’experts’ still can’t decide if crypto is a hedge or a hazard—classic.
Technical outlook: RSI cools off from overbought territory, clearing the runway for another rally. On-chain data shows whales accumulating at current levels, signaling confidence despite macroeconomic noise.
The bottom line? Bitcoin doesn’t care about your traditional portfolio theory. It’s busy rewriting the rules—and the balance sheets of those smart enough to listen.
Bitcoin Price Eyes Fresh Surge
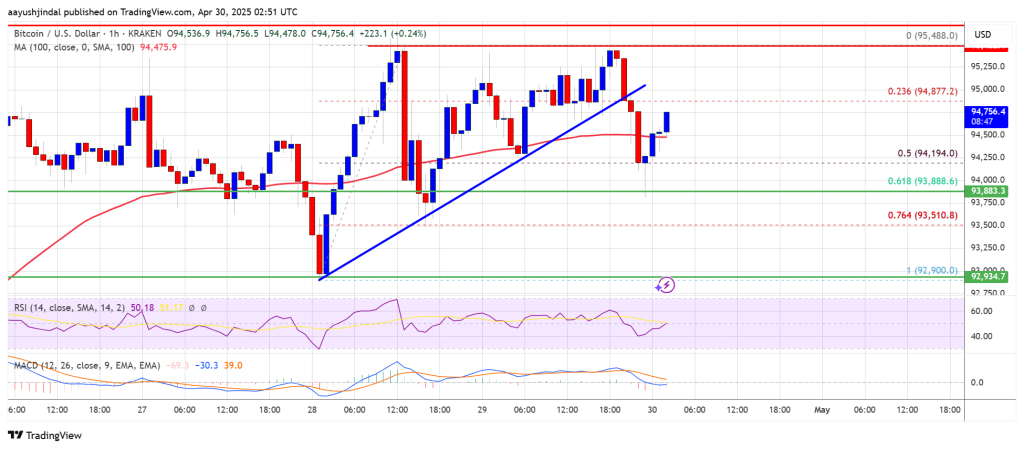
Bitcoin price started a short-term downside correction from the $95,500 resistance zone. BTC declined below the $95,000 and $94,500 support levels.
There was a move below the 50% Fib retracement level of the upward move from the $92,900 swing low to the $95,488 high. Besides, there was a break below a connecting bullish trend line with support at $94,850 on the hourly chart of the BTC/USD pair.
However, the bulls were active NEAR the $93,850 support and the 61.8% Fib retracement level of the upward move from the $92,900 swing low to the $95,488 high.
Bitcoin price is now trading above $94,500 and the 100 hourly Simple moving average. On the upside, immediate resistance is near the $95,000 level. The first key resistance is near the $95,250 level. The next key resistance could be $95,500.
A close above the $95,500 resistance might send the price further higher. In the stated case, the price could rise and test the $96,500 resistance level. Any more gains might send the price toward the $98,000 level.
Another Decline In BTC?
If Bitcoin fails to rise above the $95,500 resistance zone, it could start another downside correction. Immediate support on the downside is near the $94,500 level. The first major support is near the $93,850 level.
The next support is now near the $93,500 zone. Any more losses might send the price toward the $92,500 support in the near term. The main support sits at $91,200.
Technical indicators:
Hourly MACD – The MACD is now gaining pace in the bullish zone.
Hourly RSI (Relative Strength Index) – The RSI for BTC/USD is now above the 50 level.
Major Support Levels – $94,500, followed by $93,850.
Major Resistance Levels – $95,250 and $95,500.
