Polkadot’s 5-Year Price Prison – Will the Breakout Finally Come in 2025?

Polkadot’s price action has been trapped in a stubborn channel since 2020—bouncing between predictable support and resistance like a crypto metronome. But with the 2025 bull run heating up, traders are watching DOT’s weekly chart like hawks.
The pattern’s persistence is almost comical: five years of ’this time it’s different’ hopium followed by the same old rejection. Yet technicals hint at a potential inflection point. If DOT can shatter the upper trendline with conviction, we might finally see escape velocity.
Of course, Wall Street ’experts’ will claim they saw it coming—right after they finish explaining why their last three predictions were wrong.
Analysing Price Action Within The Channel
Cessur emphasized in his recent analysis that the green channel shown on the Polkadot chart represents a downtrend that has been in place for nearly four years. This trend has consistently guided the broader market structure, acting as a long-term resistance. However, he noted that if DOT manages to break above this channel, it could set the stage for a major trend reversal to new highs in the months ahead.
He also drew attention to DOT’s short-term outlook, where a red falling channel on the weekly timeframe has just been breached to the upside. According to Cessur, this development is a sign of potential bullish continuation, positioning DOT as one of the altcoins to start an increase.
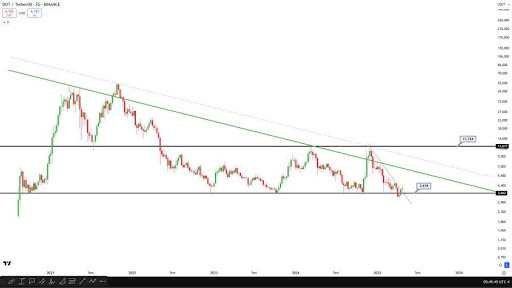
The analyst concluded that if the asset continues to follow the multi-year pattern of ranging from $4 to $12, another climb toward the top of this range seems likely. Most importantly, if the weekly candle closes above $4.70, he noted that the chances of seeing a swift move toward $10 could increase significantly, supported by growing bullish momentum and historical price behavior.
Bear Case: Losing $4 Might Send Polkadot To All-Time Lows
The bear case for Polkadot revolves around the critical $4 support level, which has been pivotal in maintaining the altcoin’s price structure. If DOT loses the $4 mark, it might signal a deeper bearish move. This would invalidate recent bullish hopes and raise the potential for further declines as market sentiment shifts to a more risk-averse stance.
Such a drop would suggest that the upward momentum observed in recent months could be a false rally, with DOT’s price unable to maintain its position above key support levels. Its failure to hold above $4 may prompt heightened selling pressure, especially when broader market conditions worsen or there’s a loss of confidence in Polkadot’s long-term prospects.
Additionally, a move below this critical support would raise the probability of a retest of all-time lows, which would be a significant bearish development for the token. In this scenario, patience and strategic re-entry points would become key factors for short and long-term holders.

Log in to Reply
Log in to comment your thoughtsComments
Related Articles
|Square
Get the BTCC app to start your crypto journey
Get started today Scan to join our 100M+ users