Ethereum’s 4H Chart Flashes Warning—Will Bulls Defend $1,750?

Ethereum’s rally hits a snag as the 4-hour chart reveals bearish divergence—classic trader bait for a pullback. The $1,750 level now stands as the litmus test for bullish conviction.
If the support crumbles, prepare for the usual chorus of ’I told you so’ from permabears. Hold? Then we’re off to the races—until the next ’macro headwind’ excuse from institutional bag-holders.
Ethereum Battles Resistance As Bulls Try To Keep Control
Ethereum is starting to show early signs of a bullish structure on low time frames, giving bulls hope for a broader recovery. After pushing from the $1,400 local low, ETH has managed to hold above key moving averages and consolidate within a tight range. However, the market remains highly cautious, and selling pressure could increase quickly if bulls fail to reclaim higher levels.
Momentum has shifted in Ethereum’s favor over the past few days, and several analysts are calling for a potential massive breakout if key resistance levels are breached. A confirmed breakout above $1,850 could open the door for a swift move back to the $2,000 psychological level. Nevertheless, risks remain elevated, and an opposing bearish view suggests that Ethereum could revisit the $1,300 zone if bulls lose control.
Ched’s critical insights point out that Ethereum is forming a 4-hour bearish divergence on the On-Balance Volume (OBV) indicator. This, combined with the appearance of an upper shadow on local structure, signals weakening buying pressure. According to Cheds, a short position could be triggered if Ethereum loses the $1,750 support zone, which would confirm a breakdown from the current consolidation pattern.

Technical Details: Key Levels To Change Structure
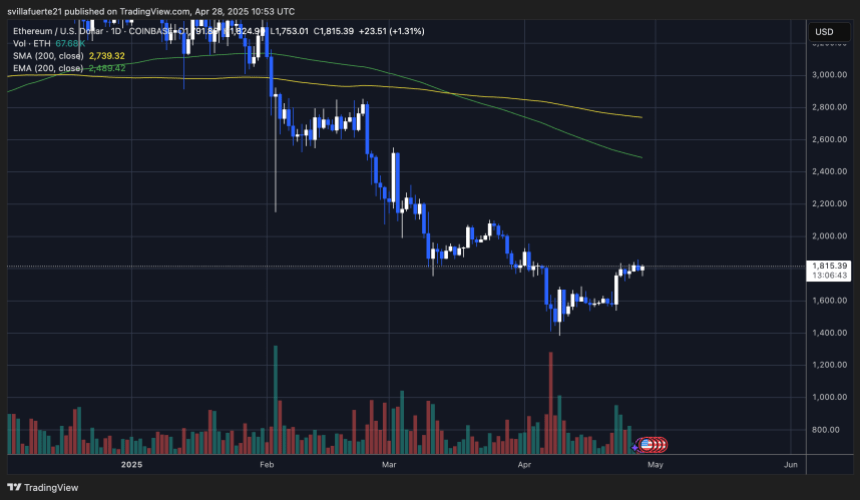
Ethereum is trading at $1,815 after days of tight consolidation and modest upward movement. Bulls have managed to defend the $1,750-$1,800 support range, but the real test remains ahead. To shift the broader bearish structure into a confirmed bullish trend, Ethereum must reclaim the $2,100 level. Without this breakout, any rallies are likely to be seen as temporary relief within a broader downtrend.
Holding above the $1,800 level is critical in the coming days. A firm base above this zone would help build strong demand and create the conditions needed for a sustained recovery rally. Bulls are gaining some short-term momentum, but they still face a market clouded by macroeconomic uncertainty and cautious sentiment.
If Ethereum fails to maintain support at $1,750, downside risks will grow rapidly. Breaking below this zone could trigger a sharp sell-off, likely sending ETH toward the $1,500 mark. As the market shows signs of strength, Ethereum’s next move will be decisive. It will determine whether it can join a larger recovery trend or continue struggling within a volatile and uncertain environment.
Featured image from Dall-E, chart from TradingView

Log in to Reply
Log in to comment your thoughtsComments
Related Articles
|Square
Get the BTCC app to start your crypto journey
Get started today Scan to join our 100M+ users