Bitcoin Takes a Breather — Here’s Why Bulls Aren’t Sweating the Dip

Bitcoin’s price stumbles—again. But if you think this is the end of the rally, you haven’t been paying attention.
The Dip Playbook:
Every crypto veteran knows the drill. A 10-15% pullback after a surge isn’t a crash—it’s a reload. Liquidity gets flushed, weak hands fold, and the real players stack sats.
Wall Street’s Tiny Violin:
Meanwhile, traditional finance pundits clutch their pearls. ‘Volatility! Risk!’ they cry—right before quietly allocating another 2% to BTC ETFs. Hypocrisy tastes better with a side of ATH.
Next stop? Either $58K becomes support… or we test $52K. Either way, the bulls are circling. Time to buckle up.
Bitcoin Price Starts Downside Correction
Bitcoin price remained stable above the $90,000 level and started a fresh increase. BTC was able to climb above the $91,500 and $94,000 resistance levels.
The bulls were able to pump the price above the $94,500 resistance. The recent high was formed at $95,348 and the price started a downside correction. There was a drop below the $94,500 and $94,000 levels. A low was formed at $92,900 and the price is now consolidating losses below the 23.6% Fib retracement level of the downward move from the $95,348 swing high to the $92,900 low.
Bitcoin price is now trading below $94,000 and the 100 hourly Simple moving average. There is also a connecting bearish trend line forming with resistance at $94,000 on the hourly chart of the BTC/USD pair.
On the upside, immediate resistance is near the $93,650 level. The first key resistance is near the $94,000 level. The next key resistance could be $94,150 and the 50% Fib retracement level of the downward move from the $95,348 swing high to the $92,900 low.
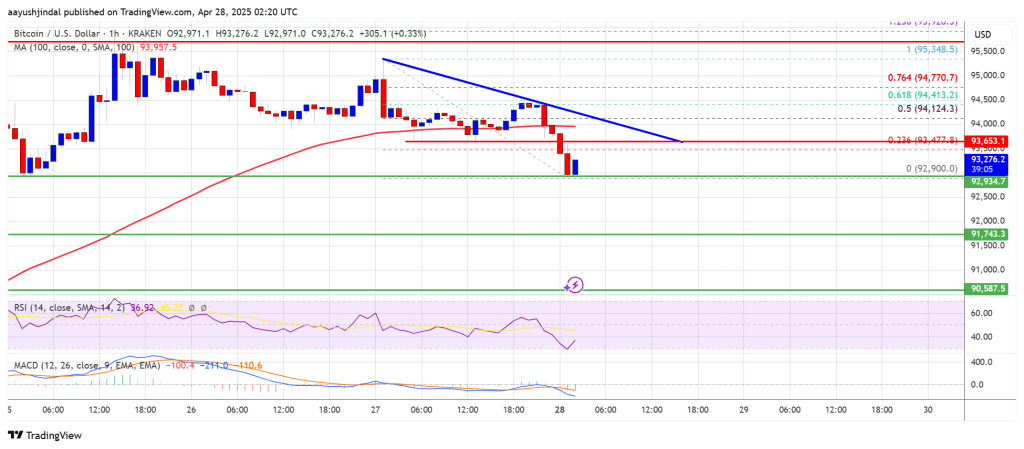
A close above the $94,150 resistance might send the price further higher. In the stated case, the price could rise and test the $94,500 resistance level. Any more gains might send the price toward the $95,500 level.
More Losses In BTC?
If Bitcoin fails to rise above the $94,000 resistance zone, it could continue to move down. Immediate support on the downside is near the $92,800 level. The first major support is near the $92,000 level.
The next support is now near the $91,500 zone. Any more losses might send the price toward the $90,500 support in the near term. The main support sits at $90,000.
Technical indicators:
Hourly MACD – The MACD is now gaining pace in the bearish zone.
Hourly RSI (Relative Strength Index) – The RSI for BTC/USD is now below the 50 level.
Major Support Levels – $92,800, followed by $92,000.
Major Resistance Levels – $94,000 and $94,150.
